Trends Tab
The Administrative Analytics Dashboard includes a Trends tab, a set of historical charts for tracking and filtering down on key metrics: enrollment, persistence, course success, and completion.

It’s a self-serve tool for key information that administrators typically must wait on others to provide, so it saves time and gets you actionable information faster.
Enrollment Trends
This chart shows enrollment information for both new and continuing students, as well as historical and current enrollment. Use this information, for example, to track the number of students enrolled on a weekly basis and compare that trend to the previous year or term, or generate a list of unenrolled students for targeted communications.
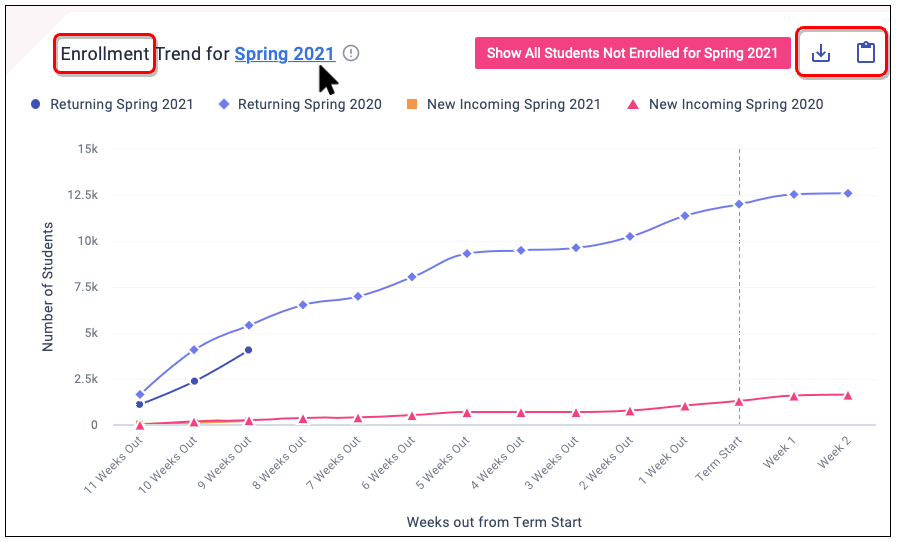
- This chart shows the count of students enrolled in the term selected.
- Horizontal: The x-axis shows the number of weeks out from term start.
- Vertical: The y-axis shows the number of students.
- Hover over a point on the graph to review enrollment data for returning and new incoming students.
- Returning students are those who have enrolled in at least one prior term at the institution.
- New incoming students are those who are enrolling for the first time at the institution.
- Enrollments are as of the last day of the week.
- Data will be shown up to 20 weeks prior to term start and 15 days after.
Take Action
Outreach to the unenrolled — Generate a list of students who have yet to enroll for the upcoming term. Use the Outreach feature to create targeted enrollment communications.
Review patterns for previous terms — Click the term name to access the enrollment trends chart for previous terms.
Review patterns for key groups — Use filters at the top of the page to investigate enrollment patterns for a key student population.
Share your insights — Download or save insights to Scratchpad to share important trends with your team.
Persistence Trends
This chart shows persistence patterns over varied time periods. Review and understand what persistence has looked like for populations of students through visual representations of term-to-term persistence. Use this information, for example, to analyze historical and predicted persistence from one term to another, or to compare historical persistence rates for all of your institution’s students or for key student subpopulations.

This chart shows the percentage of students who have enrolled past census date in both the terms as shown by the x-axis. The base population is all students with enrollments in the first term of the pair.
Students who were enrolled in the first selected term but earn a credential before the end of the second selected term are included in the numerator of the calculation, alongside students who persisted, as a positive outcome. We do this so students who complete a credential and graduate are not counted against persistence rates.
Take Action
- Review trends term-to-term — Select either term name to update results in the persistence window.
- Review patterns for key groups — Apply filters to review persistence trends between the selected group and the overall population.
- Compare two groups — Apply filters for a population you want to review. Update the Overall Population to a saved filter to compare persistence trends between two different populations.
- Share your insights — Download or save insights to Scratchpad to share important trends with your team.
Course Success Trends
This chart shows the percentage of successfully completed courses attempted, for all students or for key student groups. Generally, this factor is defined as A/B/C (successful course completion) and D/F/W (no successful course completion), but some institutions have different configurations for this data point.
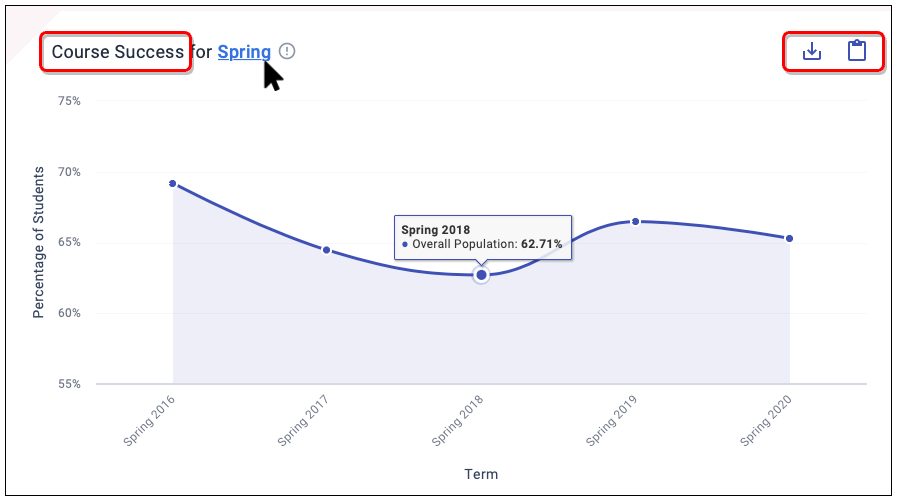
This chart shows the percentage of students who received a favorable passing grade compared to all the students who attempted the course.
- Retaken courses overwrite the grade with the most recent attempt.
- Students who dropped the course before the add/drop deadline are excluded.
- Students who withdrew are included.
Take Action
- Understand course success for key student populations, such as First-Year or Transfer students.
- Filter to better understand course success by academic area.
- Use course success to identify patterns of success for key populations that may inform sequencing.
- Combine insights from Course Insights to deepen your understanding of courses that may have a huge impact on improving course success.
- Check course success by modality, demographics, and area of study.
- Identify patterns of success that may inform sequencing.
Completion Trends
This chart shows a view of the total number of credentials awarded in a given calendar year, as well as a view of the percentage of students who earn a credential in a given time frame. For example, if you select “within 3 years” you can see the percentage of students who started in 2015 and earned a credential by 2018 compared to students who started in 2016 and earned one by 2019.) You can use this information to investigate how your completion efforts are paying off.
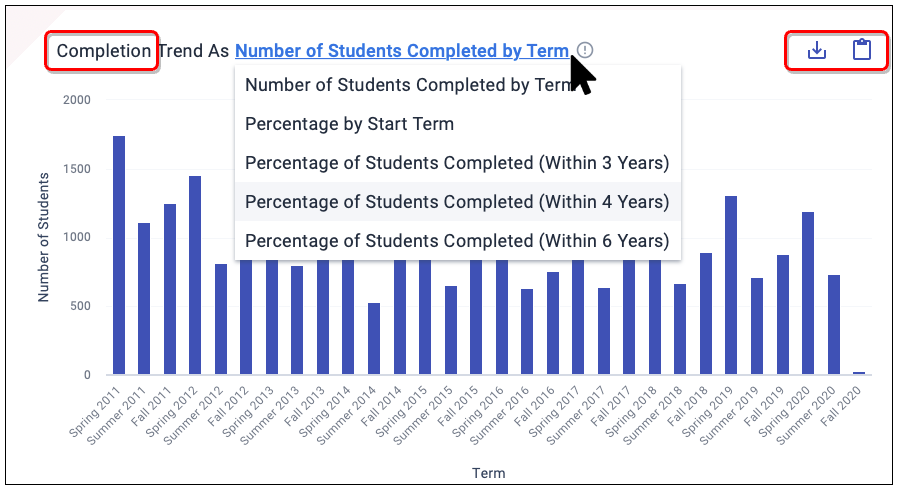
This chart shows the total count of students who earned an award in a given term. Using the drop-down list, you can change the chart to show percentages by start term and by the completion windows used by your institution.
Important: This trend chart typically will not match your IPEDs graduation data exactly, since it does not account for the manual exclusions that IPEDs allow. Therefore, this feature is not intended for external reporting; instead, use it for internal monitoring for who is earning credentials at your institution.
Take Action
- View the total number of credentials awarded in a given calendar year.
- View the percentage of students who earn a credential in a given time frame.
- Use this information to highlight the ways in which your efforts to boost completion are paying off.