Completion Predictions
Completion Predictions give long-term insights about graduation: they predict how likely each student is to complete (earn a credential) at your institution.
Can I Trust the Prediction?
Just like near-term Persistence predictions (which predict retention into the next term), completion predictions are built from your institution’s data and reflect the unique student experience on your campus, using the same data-modeling and machine-learning platform. Each student gets an individual completion prediction, based on their performance and activity relative to the historical trends for who completes degrees at your institution.
How soon is the prediction valid? — The completion prediction is available immediately for use for each student, including first-year students, without restriction. At an aggregate level, the model applies at any time, across the student’s entire time at the institution. There is a slight improvement of the predication after one year, but, overall, this prediction tracks well when comparing the prediction to actual results.
What goes into the prediction? — Common drivers of a completion prediction include:
- GPA
- Number of completed credits
- Degree program alignment scoring
- Terms since last enrollment
That last one is important for many institutions: it tracks the number of terms a student missed since they last enrolled, which helps us understand whether they can graduate on time.
However, predictions reflect your institution’s data model, as well as the machine learning on your data. Contact Support if you need the ranked feature list that underlies your predictions.
Locating Prediction Scores
Completion prediction scores are available throughout Administrative Analytics. You access them in three ways:
1 – Insights Dashboard
You access prediction data throughout the top-level dashboard, Completion Insights. These insights are driven by the values you select for the two drop-down lists, for the completion window and the start term:

Completion window — The number of consecutive years allowed between the start of the academic journey (which is the first term when courses were taken) and its finish (which is determined by the credential being earned). You have three windows to choose from (such as 3, 4, and 6), and these were configured as being the most relevant ones for your institution.
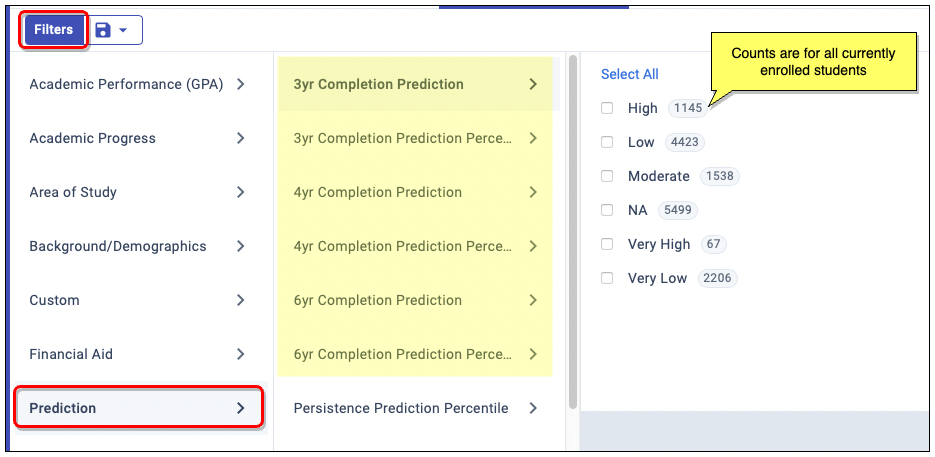
2 – Filters
You access prediction data through optional Filters, which you can select by the completion windows (number of years) that are defined for your institutions.
Important: These prediction filters in the page header apply to all pages. The counts you see reflect all currently enrolled students, not the start term selected on your Completion Insights dashboard.
3 – Student Lists
You access prediction data through a default column in Student Lists, next to the Persistence Prediction. To see additional completion windows, use the Add Column (+) button:

Note: If a student already earned their credential or falls outside of a prediction window, their Completion Prediction bucket icon will appear gray and have a status of Earned Credential or Did Not Earn Credential.
Earned Credential — In Completion Insights, Summary of Progress, counts those students who meet all of the following:
- Enrolled for the first time during the selected start term
- Remained enrolled past the census date of the selected start term.
- Match the current filters
- Finished a credential sufficient for completion
Typically a credential is a certificate or an Associate’s, Bachelor’s, or graduate degree. To confirm what specific credentials are counted as completion for your institution, contact Support.
Completion Insights Dashboard
The Completion Insights dashboard differs a bit from Persistence Insights: You always view the predictions through the lens of a specific completion window that is applied to a specific start term group.
- Completion Window options vary by institution and are ordered by duration (such as 3-, 4-, and 6-year windows). Your institution can choose whichever 3 completion windows are most helpful.
- Start Term groups are all students who started at your institution in the specified start term. Students with more than one career in the same term (such as pursuing graduate and undergraduate degrees at the same time) will be counted multiple times.

The Analysis panel offers four data views, all of which focus on actively enrolled students who have not yet earned their credential.
1 – Completion Prediction
These bars compare your group (as you have it filtered) to the overall start term group. The percentages capture how many students are likely to earn a credential by the end of the completion window you selected (such as 4 years).
- The top blue bar shows students in this window and start-term group who match your dynamic filters.
- The bottom red bar is one of your predefined views:
- Overall Population is all students in this window and start term group,with no dynamic filtering.
- From the drop-down list, select one of your saved filter sets to compare against your dynamic filters.
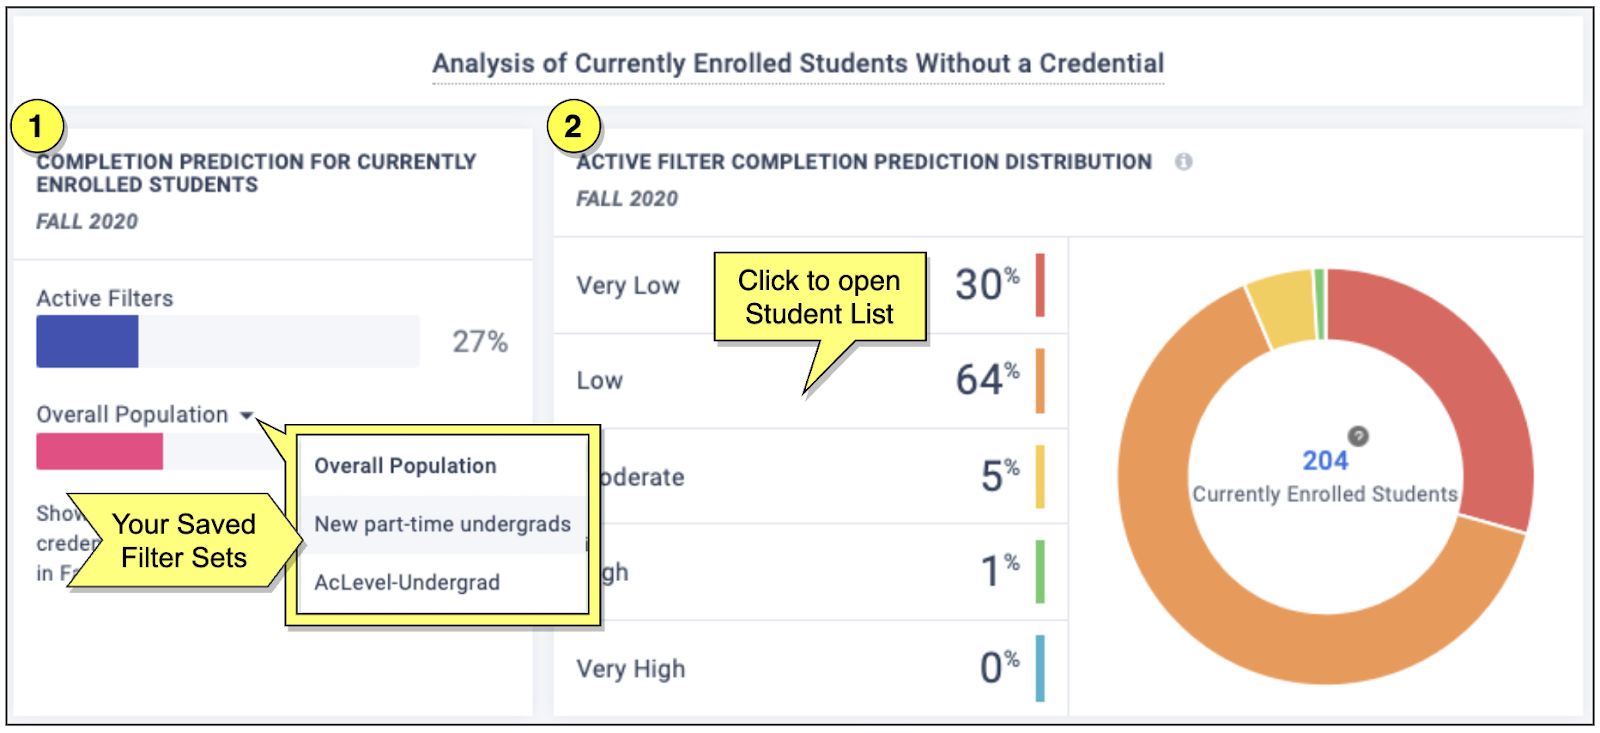
2 – Prediction Distribution
The distribution (pie) chart lets you quickly grasp the prediction breakdown for your current group, as filtered. Selecting a bucket (or the center total) opens its Student List. The buckets show how many students fall within each range of predicted success.
These are the default ranges:
- Very Low = <20% likelihood of completing a credential
- Low = 20-50%
- Moderate = 50-70%
- High = 70-90%
- Very High = >90%
Click the information “i” icon to see what’s configured for your institution.
3 – Prediction Breakdown
This charting tool breaks down many potential equity gaps in predicted completion rates. Using the drop-down list, you can view each of the key demographic comparisons to uncover discrepancies. Once you find some, just select the bar to open the Student List for that group.
These are the factors available for quick comparison:
- Part-Time vs Full-Time
- Financial Aid
- Gender
- Race & Ethnicity

4 – Engagement Opportunities
These are crafted, prebuilt student lists surfaced from data insights, research, and customer feedback. These ready-to-use lists target students who may need engagement now:
- Those with high persistence but low completion predicted
- Those not registered yet for any upcoming term
- Those who were active within the last year and have not completed their program
Selecting one of these Engagement Opportunity buttons opens the Student List of those who are a match right now. (Who matches will update and change throughout the term.)
Taking Action — When you open any student list, you can take action:
- Add data columns for more context and targeting
- Send a direct email Outreach
- Download a student list to share with your team