Student Lists for Action
Student Lists help you take action by giving you filterable data on currently enrolled students. You can access a Student List several ways. Which students appear on your list depends on which filters you applied and how you accessed the list (from a prediction bucket, Powerful Predictor, or another way).
Targeting your List
In addition to applying filters, Student Lists give you several ways to adjust your group selection:
Apply List Options
Use the buttons above the list to do more to rescope your list:
- Hide those with credential — Ensure that your student list does not include any students who have already earned their credential, so they won’t be included in any actions you take with this list.
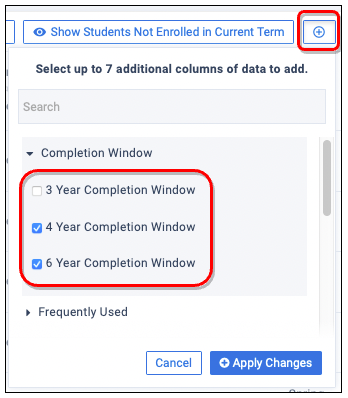
- Add inactive students — Although lists default to showing only active students, you can click Show Students Not Enrolled in Current Term to include inactive students who meet the same filters and were enrolled at some point within the last 12 months.
- Add more data columns — Although lists default to showing certain data, you can click the ⊕ “plus” sign at the top to add more columns, to filter for a more targeted action.
Adjust Completion Windows
Unless you select a different completion window (number of years to graduate) from the Completion Insights tab, the list takes the default window. This default will be the middle of the three (or more) completion windows set for your institution.
Tip: You can add the other completion windows as additional columns of data:
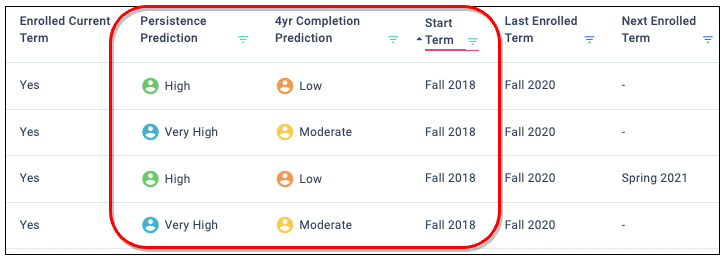
Comparing Predictions
For easy comparison, Persistence Predictions appear next to Completion Predictions. Clashing predictions indicate groups of interest, such as students scored for high persistence but low completion. By sorting or filtering a student list based on the start term and completion prediction, you can find those who need attention most urgently. These students may be off-track for their degree programs, or they may intend to transfer out.
Tip: You can quickly access this particular group from the Engagement Opportunities on the Completion Insights tab.
Taking Action
Downloads and sharing
You can use the Download button and share a Student List with the students’ advisors. They can meet with these students to clarify any intentions the students may have about transferring, and they can assist students with registering for the right courses or to ask about their academic plans.

Outreach nudges
You can use the Outreach button in the top right to send this group a short mindset nudge normalizing the feelings that college can be tough and sharing what “successful” students do when they face adversity (such as seeking out advising, tutoring, or the writing center).
Focus: Near completers
You can use prediction distributions to find “near completers”: students who should be graduating soon but are at risk of not completing.
- At the top of the Completion Insights tab, select the correct completion window and start term. (For example, if it’s now Spring 2022, you might select “4 year”, “Fall 2018”.)
- From the distribution (pie) chart, open the list for students who fall into the “Low” (orange) or “Very Low” (red) completion prediction buckets.
- With the Student List open, narrow the group further as needed by applying more filtering to the predictions and other columns.
At-risk students — Before taking advisory action with your student list, review what you have in place now to support completion in a student’s final term.
- Do you plan for special advisor outreach to students who should be graduating?
- Do you have a graduation “help desk?”
- If so, share the student list with these staff members, so they can better personalize their outreach and support.
- If not, see if you can have the advisors or an advising team proactively contact this group of at-risk students.
Lower-risk students — Consider sending a nudge, framing your outreach as “checking in to see if they need anything to finish strong.” Remind students of resources such as graduation help desks.
Important: The goal with all outreach is to start an encouraging conversation. Never label, frighten, or accuse students: “You’re at risk of not graduating: why?”
Focus: Equity gaps
When looking for potential equity gaps affecting completion rates among your student population, start with what you know:
- Note which groups of students are already targeted by your institution with regards to closing equity gaps.
- Think about which groups you would want to support proactively if you knew which students were most likely not to complete.
To identify a broader sweep of potential equity gaps with regards to completion, open the Completion Insights tab and use the Prediction Breakdown chart options. Checking the charts for the different demographics in the drop-down list will let you scan student group attributes to see if there are gaps in predicted completion rates.
For example, you might be considering older students in particular, so you set a top-level filter (Filters > Background/Demographics > Age > 22+):
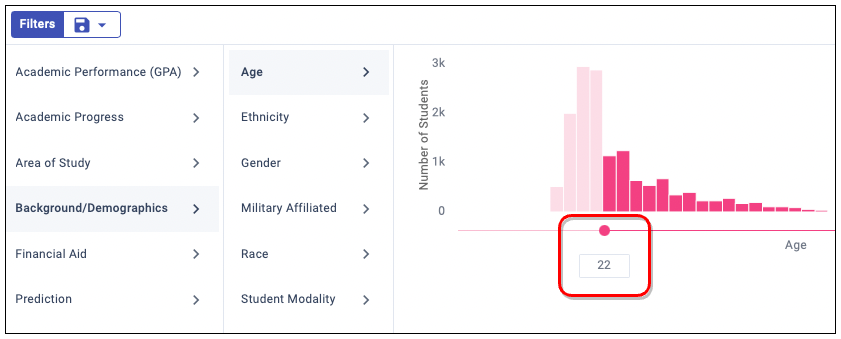
Next, you might check the Breakdown categories to dig deeper. These might reveal a disturbing drop-off in predicted completion for those who self-pay their costs, which calls for investigation and action.

Take action according to what you find:
- If the gap you found is unexpected, alert your teams. They might shift or broaden their efforts.
- If you confirm a completion gap for which efforts are already underway to support that particular group, reassure your colleagues that the data confirms they are on point.
- Share the subgroup of students that are most at risk of not completing. This can help staff to focus resources most effectively.