Analytics Overview
Following are the capabilities and operations you can do with Analytics. Any differences between what you see here and what you see in your instance are due to customization changes or permission levels that you may not have.
Data, Insights, Action
The Student Insights Engine ingests your institution’s historical and current term data and applies predictive models in order to predict retention and completion outcomes for each of your students. Administrative Analytics follows this flow:
- Unifies your diverse data sources
- Applies predictive analysis and compelling visualizations
- Brings meaning to your data
Use Administrative Analytics to maximize the insights possible from your student data, and use those insights to drive your strategy:
- Bring data together from different sources and optimize it for analysis.
- Understand insights surfacing in the data in the context of your institution.
- Decide on reasonable actions your institution can take as a result of new insights.
- Learn from those actions to discover what works for your unique student population.
These are ways your team will use Administrative Analytics:
- Apply filters to narrow down your student population into meaningful subsets for analysis and comparison.
- See what factors contribute to student persistence and completion in order to identify students at risk of not persisting or not completing their credential.
- Send nudges to target student groups for which you have identified data-backed opportunities to take action.
- Save filters to easily return to the student groups that interest you the most and see trends over time.
- See what variables are most predictive for your institution’s students, enabling you to focus initiatives on the Powerful Predictors with the greatest potential impact.
- Compare multiple Powerful Predictors side-by-side and see how their effects might compound.
- After finding an insight in your data, use the Student List of impacted students to run an outreach campaign or to export for other actions.
Your Custom Model
Civitas Learning’s dedicated team of data scientists create predictive models to deliver powerful insights about your institution’s student data. We start by extracting your institution’s historical data from your SIS (Student Information System), LMS (Learning Management System), and any other data sources you choose to include. Using that data, institution-specific models are created:
- Civitas Learning ingests data from your sources and creates additional data points, called derived variables.
- After historical data is collected, segmentation strategies are tested. Segmentation occurs to inform the creation of multiple models using different sets of variables depending on what may be predictive for different types of students. For example, the variables that are most predictive of whether an online, undergraduate student persists may be very different than the variables that are predictive for an on-ground, graduate student. The variables are chosen based on a hypothesis of what selection will deliver the strongest models for your institution.
- Quick testing reveals the predictive power of these models. If the initial hypothesis did not deliver strong results, new segmentation strategies are tested until the most effective models are identified.
- The final result is multiple institution-specific predictive models that account for your institution’s unique students.
- After testing, these models are ready for use with your active students. We ingest current student data from the same sources and apply our predictive models to deliver an individual persistence prediction for each student.
Your Toolkit for Research
The research tools are organized into dashboards that visualize vast amounts of data into easy charts:
Persistence — Persistence is the measure of retention success: that students (1) re-enroll in a future term at your institution, and (2) stay enrolled past the census date (typically 2 weeks into the term).
After modeling your data, Analytics can give you many views into predicted persistence:
- Your institution-specific predictive models generate a persistence prediction for every student. This prediction shows how likely they are to persist on to a future term.
- The average of every student’s persistence prediction is calculated. The average persistence prediction surfaces as the institution-wide persistence prediction, displayed as the persistence prediction for Overall Population.
- As you add filters, the persistence prediction updates to reflect the same calculation for the students meeting the selected filter criteria, displayed as the persistence prediction for the ‘Active Filter.’
Powerful Predictors — After modeling, your best predictors of persistence at your institution are ranked from your historical data:
- Variables with the most predictive power are determined and ranked.
- The most predictive variables are called Powerful Predictors. Their ordering will dynamically change as you add filters, because they update to reflect which students are currently included.
- Each Powerful Predictor can be opened for data visualization, where you can select the portion of the chart that represents the students you need to reach.
- Each Powerful Predictor can be paired with another Powerful Predictor, for immediate charting and analysis.
Courses — Course insights uncover where student performance correlates to larger outcomes (such as that poor grades in Freshman Composition link strongly to failure to graduate). By discovering which courses have the most impact on graduation or retention, where students benefit most from boosting grades, and where students are struggling the most, you can see what to do (such as to add support services or have advisors focus on student performance in specific high-impact courses).
Completion — Where persistence focuses on short-term success (retention), completion insights focus on long-term success (earning the credential). Your toolkit includes a dashboard of visualizations to help you find students at risk of not finishing.
In addition, each Student List includes individualized prediction columns for both Persistence and Completion, for easy tracking and comparison. You can also filter on this prediction data:

Your Toolkit for Action
Armed with data insights, you can take action several ways:

Accessing Analytics
When your deployment is completed, you will receive a unique link to access Administrative Analytics along with your login information.
If your institution uses SSO (single sign-on), Administrative Analytics may be configured to work with those credentials.
Permissions
Administrative Analytics uses a global sidebar that separates the staff functions (above the line) from the admin functions (below the line). What you see depends on your user permissions:
Basic Access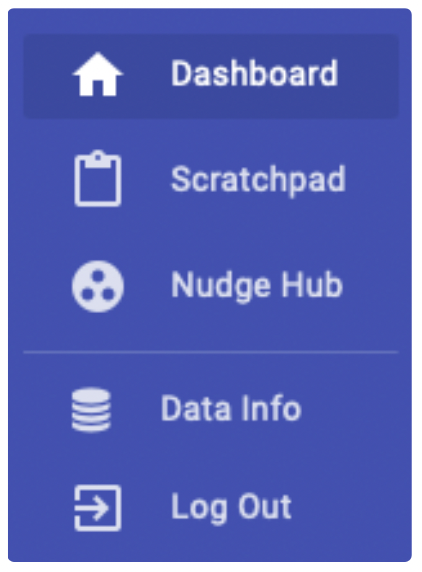 | Full Access |
If you suspect that you are missing access permissions that you need, contact your Analytics administrator to check User Management.