Scratchpad Saving and Sharing
Scratchpad gives you a place to save a snapshot (chart image) and comments of any Powerful Predictor chart or Paired Predictor Plot. You can share these snapshots with all Analytics users at your institution and your Civitas team, or you can store them privately for your own reference.
Saving to Scratchpad
Once you save an insight (a chart or plot of interest) to Scratchpad, it is available for viewing, searching, downloading, and sharing.
- Select a Powerful Predictor chart or Paired Predictor Plot.
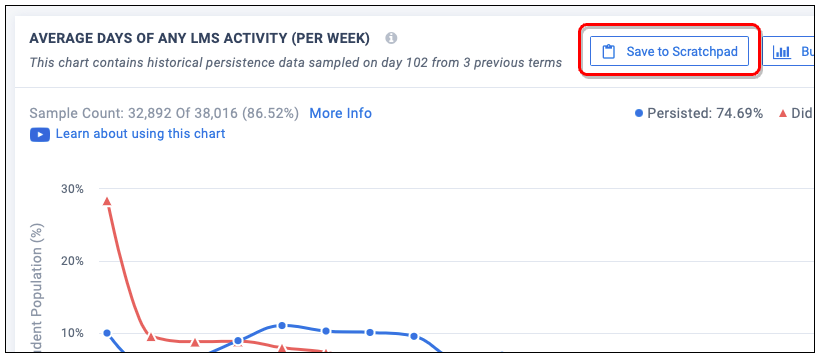
- At the top right, select the Save to Scratchpad button. This captures a snapshot, which is an image of the chart at this moment in time.
- To see what you’ve saved, select Scratchpad from the sidebar menu.
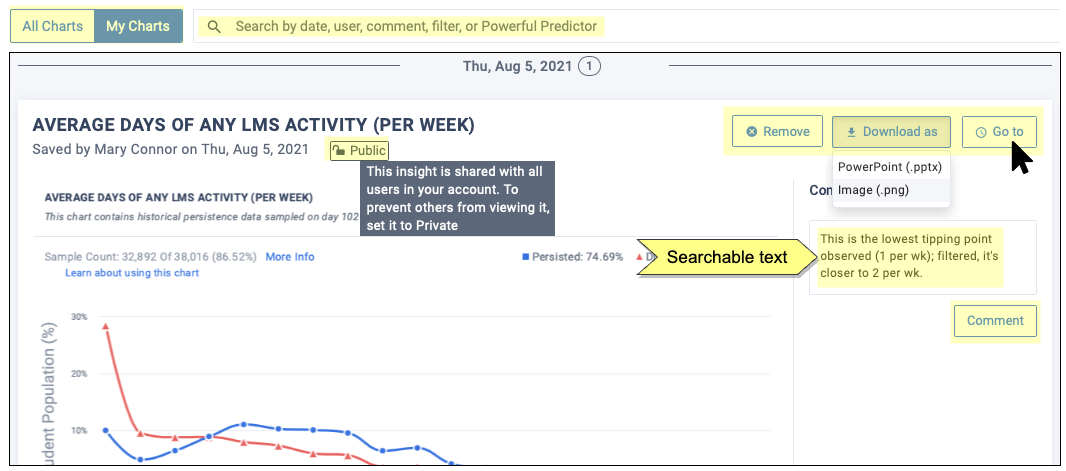
- It opens to All Charts, which shows everyone’s insights. Select My Charts to see just your own.
- To keep your team from seeing this insight, select the Public (lock) icon, which toggles it to Private.
- The Go To button lets you reopen the live view again, as filtered.
- Best practice: Add a Comment with an explanation, motivation, or context for saving this insight.
- Comments can be edited and deleted.
- Several people can comment, so your conversation is kept with the snapshot.
- Tip: Comment text is searchable, so add text that will help you find this insight later.
- To find an insight, use the Search box at the top of the page and type search criteria: the name of a Powerful Predictor, a user, some comment text, or a filter.
Saving Ranges
If you Save to Scratchpad after highlighting a range (clicking and dragging a portion of the chart), the details located above the chart will be included in the saved image. (If you use the Go To button above a saved insight, the chart will open but the range will not be selected.)

Saving Paired Predictor Plots
To capture the relationship between two Powerful Predictors on historical persistence rates, save the pairing:
- Select the Build Paired Predictors button above the chart.
- Choose a second Powerful Predictor for the pairing.
- Above the charts, select the Save to Scratchpad button to capture a snapshot of both plots.
Working with Saved Insights
When you select Scratchpad from the sidebar, you first see all saved charts, including yours and all of those saved publicly by colleagues or your Civitas team.
Use the Search bar or the sorting options at the top of the page to help you locate the insights you want to share.
To understand a saved chart
- Look at the chart title to see which Powerful Predictor (or two, if a pair) generated this insight.
- Look below the title at Saved by to find which user saved this chart on which date.
- Look below the chart image to see the Filters Used when this insight was saved.
- To return to the live chart or plot with the same filters applied, select the Go To button at the top right.
- If you revisit the chart during the same term the insight was saved, it should look the same.
- If you revisit it during a future term, it may look different as a result of new data inputs.
- Returning to the live chart allows you to highlight a range of values or hover over persistence details.
To change the privacy
Your insights are public (shared with your colleagues) by default. These are the ways you can control what others see:
- Hide insights — To make an insight private, select the toggle labeled Public to make it visible to you only. When Private, no other user can see or search on the chart, the filters used, or its comments.
- Add comments — On any insight you can view, you can Comment to ask or answer questions or call out important points. This allows team-level discussions specific to a given insight.
- Edit comments — Hover over any of your own comments and select the ellipsis (…) icon to edit or delete your comment.
- Delete insights — Delete any of your saved insights by selecting the Remove button at the top right.
Note: You cannot make other users’ insights private, edit or delete other users’ comments, or remove other users’ insights.
To download a slide or image
To export insights for use in emails, reports, or presentations, select the Download as button, to the top right. Which format you choose depends on your need:
- Image (.png) — Choose the PNG version if you only want the chart itself, or if it’s important to have the smallest file size.
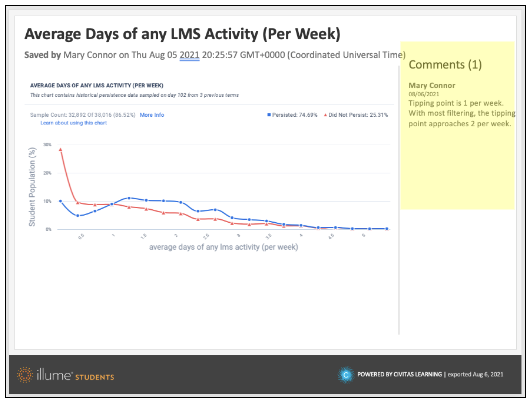
- PowerPoint (.pptx) — Choose the PowerPoint option for a slide that you can insert or import into your deck. It includes both the Comments and a footer design:
Tip: If you are preparing for a presentation or will be exporting insights regularly, decide on search keywords to include in Comments so that you can filter for exactly the ones that you will need to export. For example, if you have a council report each quarter, you could add “2021Q3” to a Comment to flag and find the insights for that Q3 report.
Because colleagues who do not use Administrative Analytics cannot access insights directly, use the Download function to generate shareable formats.
- Open the saved insight that you need to share externally.
- From the top right, select the Download as button and choose the PowerPoint (.pptx) or image (.png) format.
- Share the downloaded file, which includes filter information and comments, as appropriate (such as an email attachment or an upload to network storage).