Advising Dashboard
After you log in, you see a dashboard designed to help you jump into your advising work.
Important: Which dashboard you see depends on what’s enabled for your SSU.
- Advanced Dashboard — includes clickable insight charts for reaching students based on their engagement and persistence predictions (likelihood of staying enrolled)
- Basic Dashboard — provides essential summaries and navigation links
Advanced Dashboard
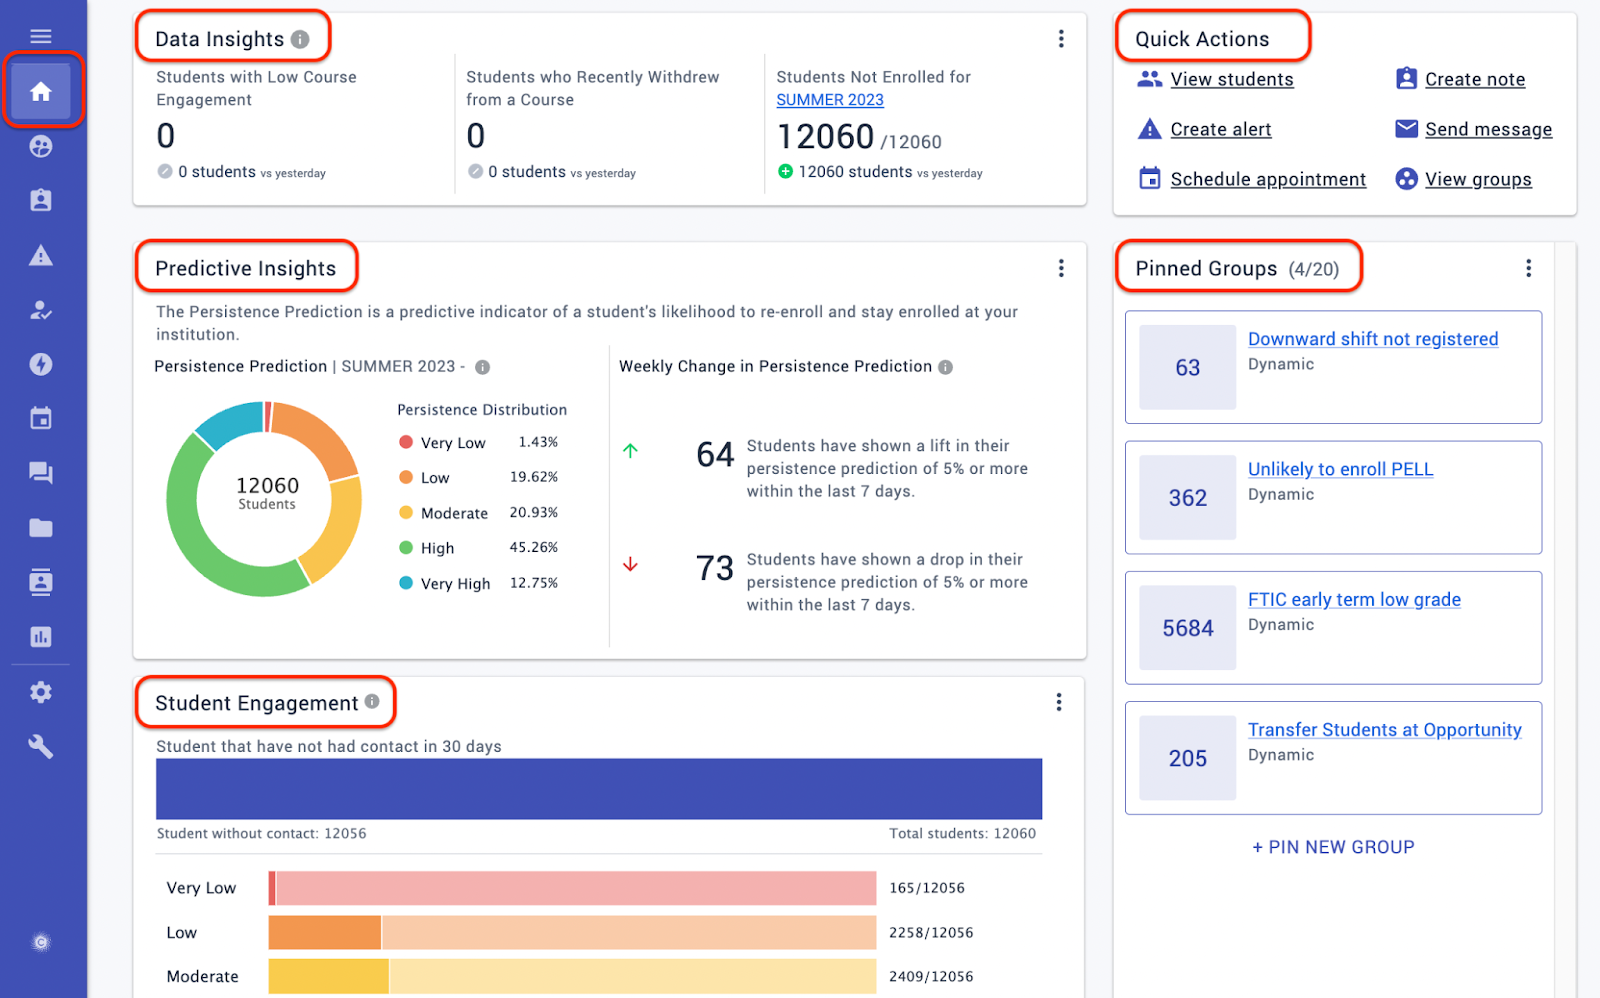
If your institution enabled the advanced Dashboard for your SSU, you see a large set of data-driven widgets to prompt you into effective action.
The Advising Dashboard renders analytics intelligence into insight charts, so that advisors can click into precise subgroups of students who need their help the most. These insights leverage each student’s persistence prediction, which is their likelihood of staying enrolled (based on historical data). All of the charts refresh when you change the data view.
Important: Which dashboard advisors see depends on what’s enabled for your SSU. Unless this is enabled, you will see the Basic Dashboard, with the legacy summaries, panels, and navigation links.
What if I don’t have assigned students? — With assigned students, the dashboard defaults to showing you insights for your students. If you do not have assigned students, the dashboard defaults to All Students, which sets the dashboard to show data for all the students that you have permission to see. For you, it will be crucial to set up Pinned Groups (see next) to get the student insights you need. In combination with the Recently Used group listing, this puts you one click away from the filtering you depend on for your work.
Because the Dashboard can have a huge impact on your productivity and effectiveness, take time to familiarize yourself with all it offers:
Pinned Groups
Starred ★ groups are shared across your team, but you can Pin 📌groups for your personal use, as shortcuts on your Dashboard. This is critically useful if you don’t have students assigned to you.
Here are examples of groups that you might pin:
- Students on probation academic standing
- Students with an unresolved alert
- Students who are inactive yet are in good academic standing
Pinning is more than a Dashboard shortcut: Pinned groups become filters that you can search for and apply to the dashboard insights. Because of this, take time to create and pin groups that you want to have available as insight filters.
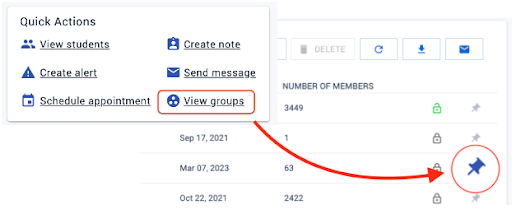
How do I pin one? — To pin a group, select Quick Actions > View groups and click the pin icon to the right of the group (if you don’t see the pin icon, use the scrollbar at the bottom of the page to scroll right):
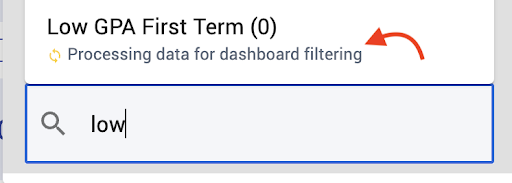
When can I use it? — Because the insight data for a newly pinned or starred group isn’t available immediately, look for status information in the filter drop-down to let you know which pins are still being processed. Processing finishes overnight, so you can use your new filters the next day.
Filtering Students
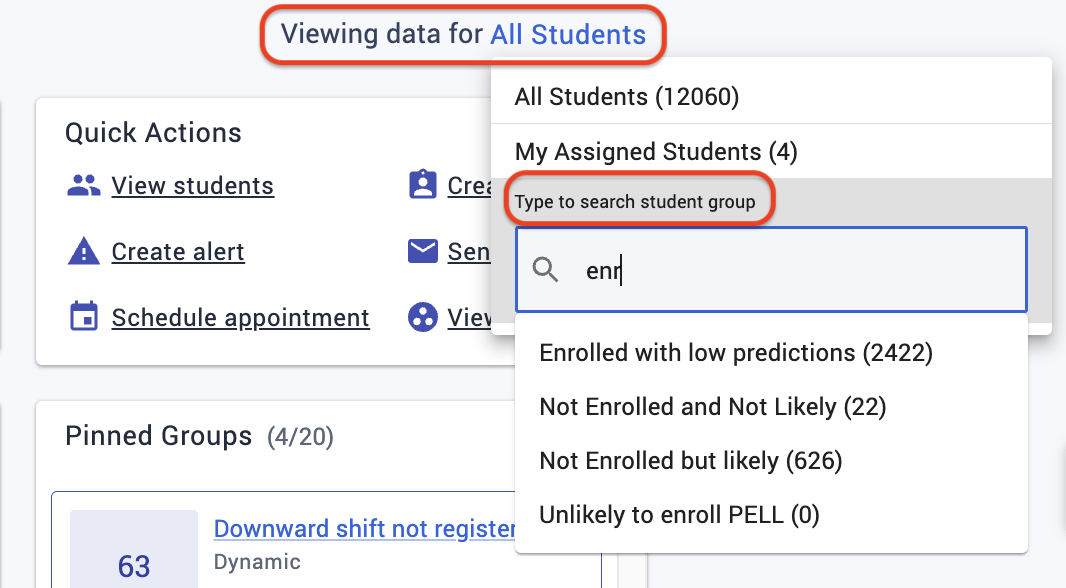
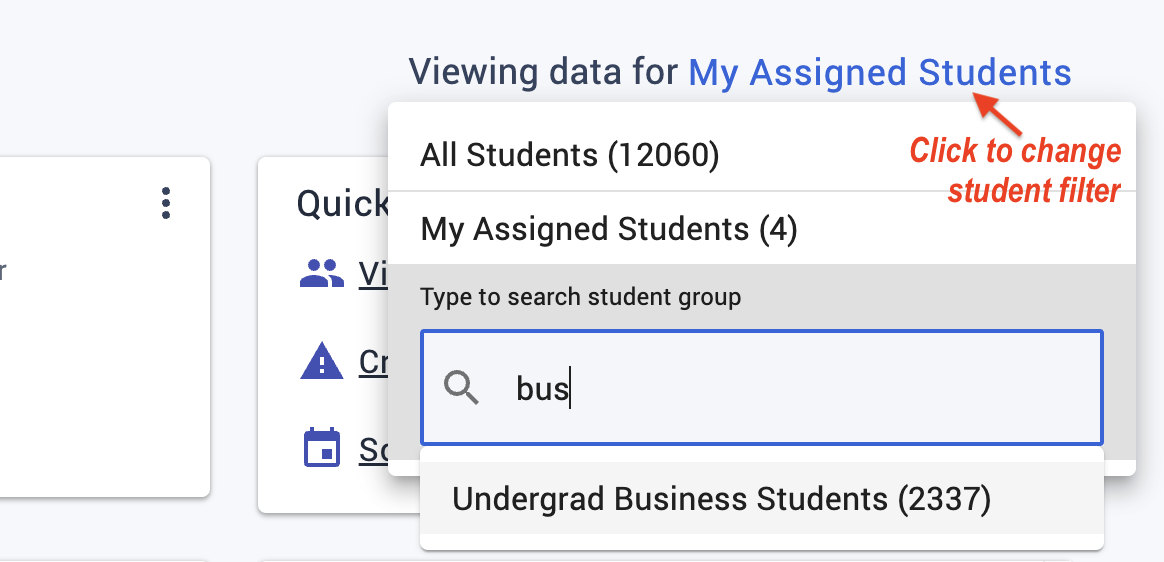
The power of the Dashboard lies in its ability to filter student data. As soon as you select a new data set from the Viewing data for… drop-down menu (top right), the entire page of insights refreshes the charts and panels for this new group of students.
- If you have an assigned caseload, the dashboard defaults to filtering for My Assigned Students.
- If you do not have assigned students, then the dashboard starts with All Students (these are all of the students you are allowed to see in your SSU).
- You can type-to-search for a group that has been Starred or that you have Pinned for your own use. As soon as you select a group from the search results, the insights are all filtered to that group:
Recently Used Groups — The dashboard remembers the last five groups that you used to filter the dashboard; these appear on the filter drop-down panel so that you can select them again quickly:
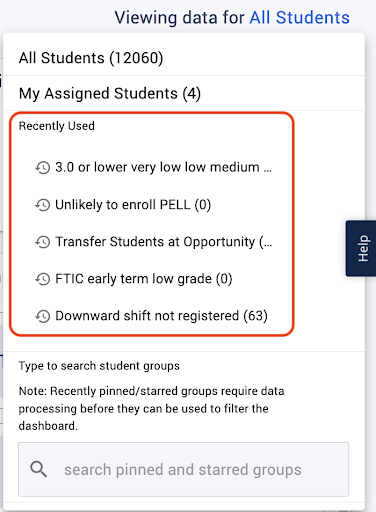
Where is my new group? — Because the insight data for a newly pinned or starred group isn’t available immediately, look for status information in the filter area to let you know which pins are still being processed. Processing finishes overnight, so you can use your new filters tomorrow.
Data Insights
The top of the Dashboard gives you a panel of Data Insights, for common issues needing intervention. Below the totals are the changes since the prior day, to help you spot upsurges. The icons and colors signal the underlying meaning of the trend:
- When rising numbers mean trouble (such as a rise in student holds), the visual indicator is a red plus sign.
- When falling numbers mean success (such as a drop in withdrawals), the indicator is a green negative sign.
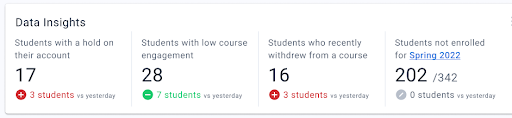
These are the concerns covered, from left to right:
- Account holds — all students with at least 1 hold, which can block registration
- This panel appears only if Advising is set up to access holds from your SIS
- The student list includes a Hold Type column, if if mapped from your SIS
- Tip: Segment the list further to display the type of holds associated with the students in question. You can then do outreach specific to the type of hold.
- Low LMS engagement — low LMS logins compared to the average for their section
- This panel appears only if Advising is set up to access your LMS data
- Tip: Filter by a starred/pinned student group to target students within particular programs, courses, or demographics
- Course withdrawals — recent withdrawals during the active term
- The student list includes columns for Last Withdrawn Class (course) and Most Recent Withdrawal (date), for the student’s most recent withdrawal
- Tip: Target specific segments by selecting a starred/pinned student group:
- Lower persistence scores
- A 5% drop in their weekly persistence scores
- Part-time students
- Those with a history of withdrawals (this would be a static group)
- Not enrolled yet — no record of enrollment for the selected upcoming term
- If more than one term is enrolling, you can open the drop list to select among them.
- Tip: Handle students with holds separately from those with none, because they need different guidance.
Predictive Insights
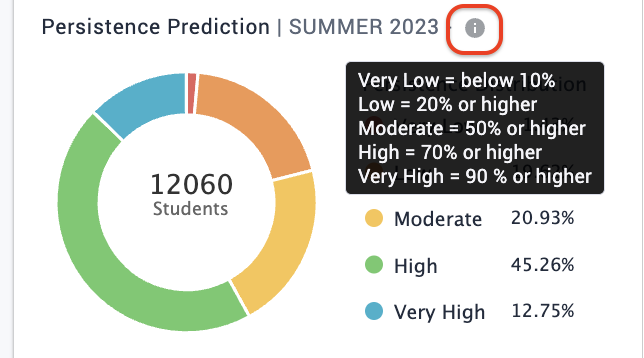
Below the Data Insights panel are the Predictive Insights, which reveal the persistence prediction ranges for your selected students. Persistence prediction is a student’s likelihood of staying enrolled (based on your institution’s historical data). It’s the key to identifying students needing attention.
- To see the Persistence Distribution ranges (buckets) behind the donut chart colors for your institution, click the information (gray “i”) icon:
Once you open a student list for a bucket, you can add additional ranges (such as to add Low and Medium to Very Low). - Use the Weekly Change in Persistence Prediction counts at right to target students with a fast shift in their persistence scores, which warrants attention:
- ↑ Lift — Tracking rapid improvement in prediction scores helps you see progress, detect impacts of interventions that your team is conducting, and find and encourage students who are making new efforts to engage on campus.
- ↓ Drop — Tracking rapid worsening in prediction scores helps you catch students who may be in crisis, even if their grades don’t yet show it. The drop reveals significant changes in their behaviors (which the LMS and other data sources pick up on), perhaps from an issue that could potentially end their college career: illness, financial crisis, mental health challenges, or loss of a loved one.
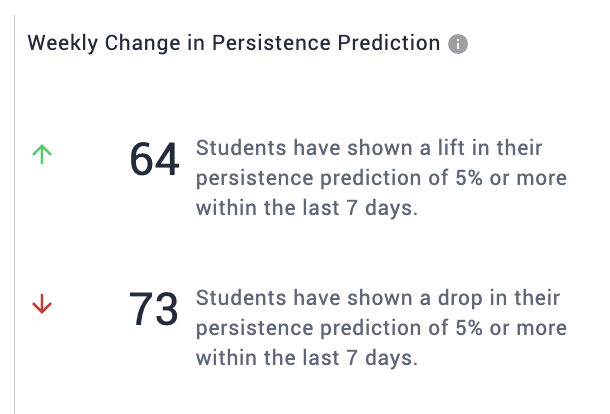
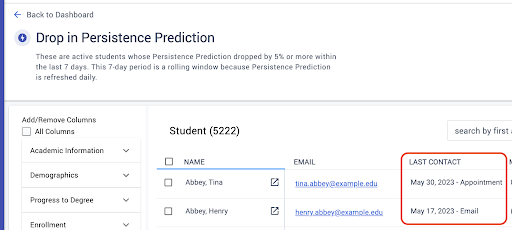
Using these charts — Wherever you see numbers or colors on these charts, click to open a Student List for outreach to those selected students. For example, clicking on the 73 count of students with a 5% drop in persistence (shown above) will open a Student List page with those 73 students:

Sorting by last contact — Each student list you open from the predictions includes a column for Last Contact, which combines when the student last had Advising contact and what kind (such as an appointment or an email). Click the header to sort by the contact date. If you don’t see Last Contact, use the scrollbar at the bottom of the page to scroll right:
Student Engagement
Engagement refers to students receiving contact (email, SMS) or support (advising note) that is logged in the Advising platform.
The graph counts the currently filtered active students who have not had any Advising engagement the last 30 days. The large bar totals the current student group, while the colored bars divide them into clickable buckets by persistence prediction:
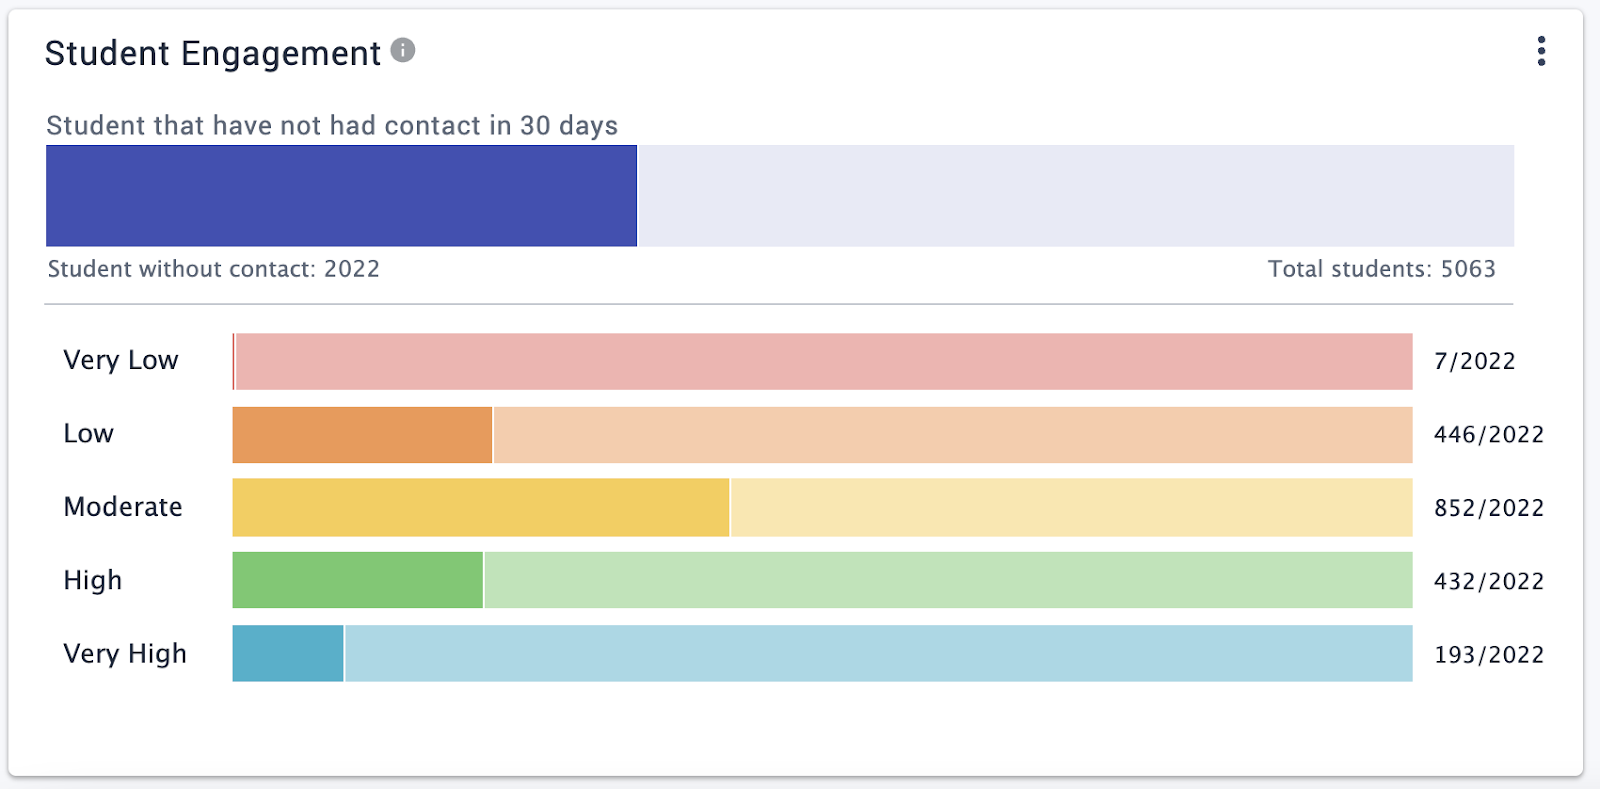
Click through these persistence prediction buckets to reach out to students who most need engagement.
How to Act on Insights
Here is how to put all of this together, to follow through with an insight so that it creates an impact for your students:
- Choose your population — The insights reset according to the Viewing data for… selector (top right):
- Default: My Assigned Students – Only those in your caseload (if you have one)
- Maximum: All Students – Every student you have permissions to view (in your SSU)
- Type to search: Student Group – Only those in a static or dynamic Group (starred or pinned)
- Open your insight — For any data insight (count, tile, chart, or bar), clicking it opens the list of students reported as having that specific status.
For example, selecting the uncontacted bar for Very Low prediction students opens a list that only contains low persisters from your selected population who need contact:
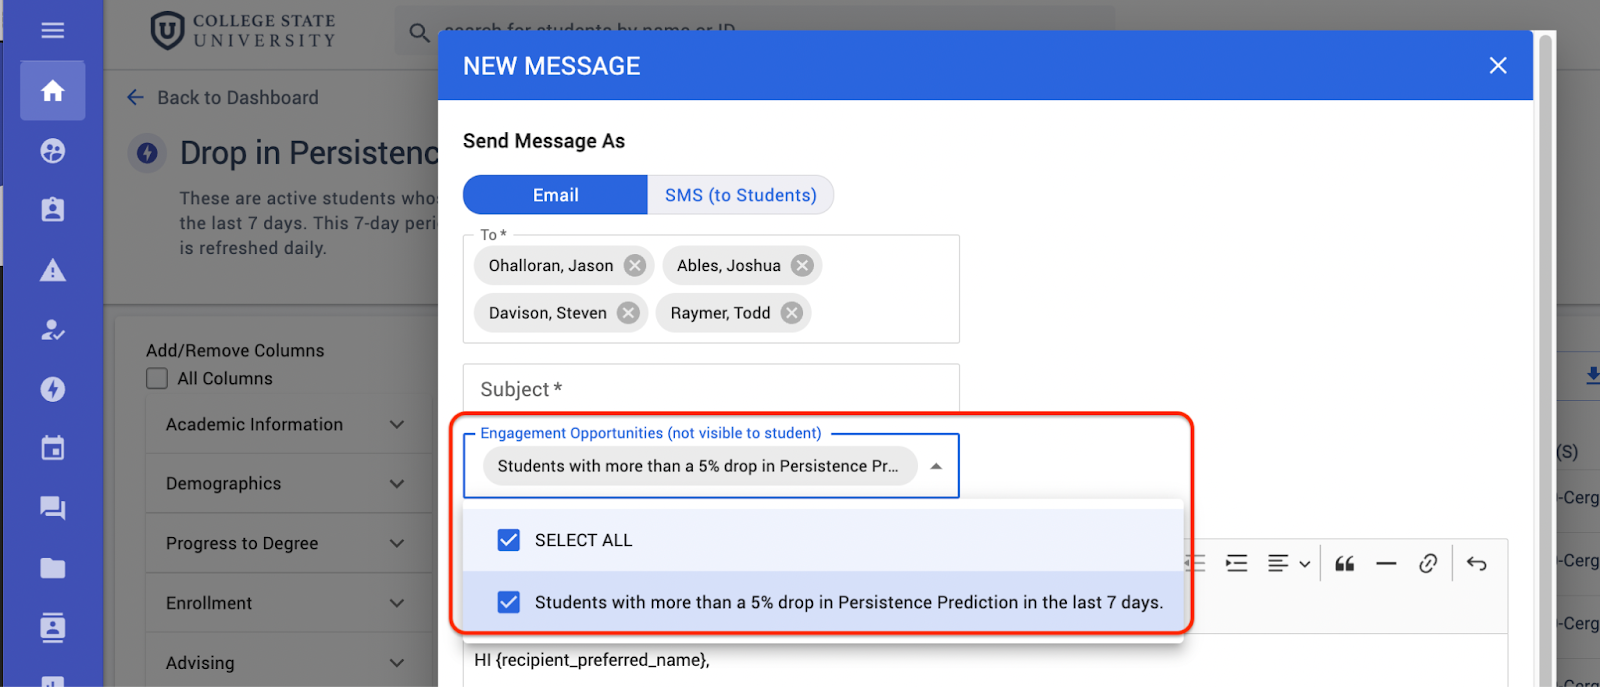
Tip: Use Add/Remove Columns to display additional columns that will help inform you in making thoughtful outreach. - Contact the students — Once you select some or all of their names, you can click the Message (envelope) icon. You have much control about how to do your outreach:

- Recipients — Either contact these students one-by-one or in bulk. For bulk, you can click the Select All box and then manually delete students from the To list as needed.
- Method — Send out by Email or SMS (text message). With SMS, you won’t have a Subject line or a signature that shares your contact information. If a recipient opted out of SMS, you’ll know because you’ll be prompted for a Subject line for their email.
- Opportunities — Link this outreach to the insight (use the Engagement Opportunities selector):
- Advising Note — In most cases, it’s best to enable the checkbox to create an Advising Note for this outreach, for reporting.
- Export the workflow — If your institution needs these students handled through another workflow, use the options to prepare and export the student data:
- Use the left panel to Add/Remove Columns for just what data you want to work with. If in doubt, enable All Columns.
- Select the Download (down arrow) icon to export an XLSX file of this data, which you can open in your spreadsheet application and share with your team by email or file server. A copy is stored in your Downloads list.
- Use the left panel to Add/Remove Columns for just what data you want to work with. If in doubt, enable All Columns.


Basic Dashboard
Access student information from the Advise panel on the dashboard or the left-side menu, the Students icon. Jump to view a student at any time using the search box at top, by typing a name or student ID.
Important: Your view may show different options based on your role in the system.
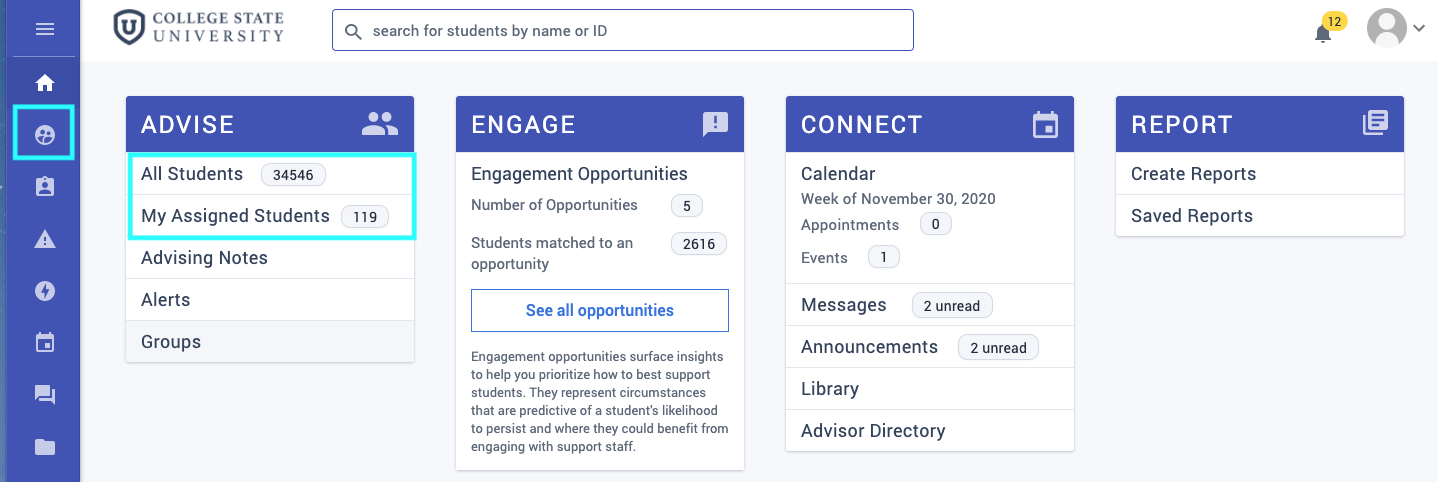
When you open the Students list, you may be able to toggle between All Students and My Assigned Students, depending on your role.
- Click Advanced Search to find students or groups with specific characteristics.
- Enter your criteria and click Search.
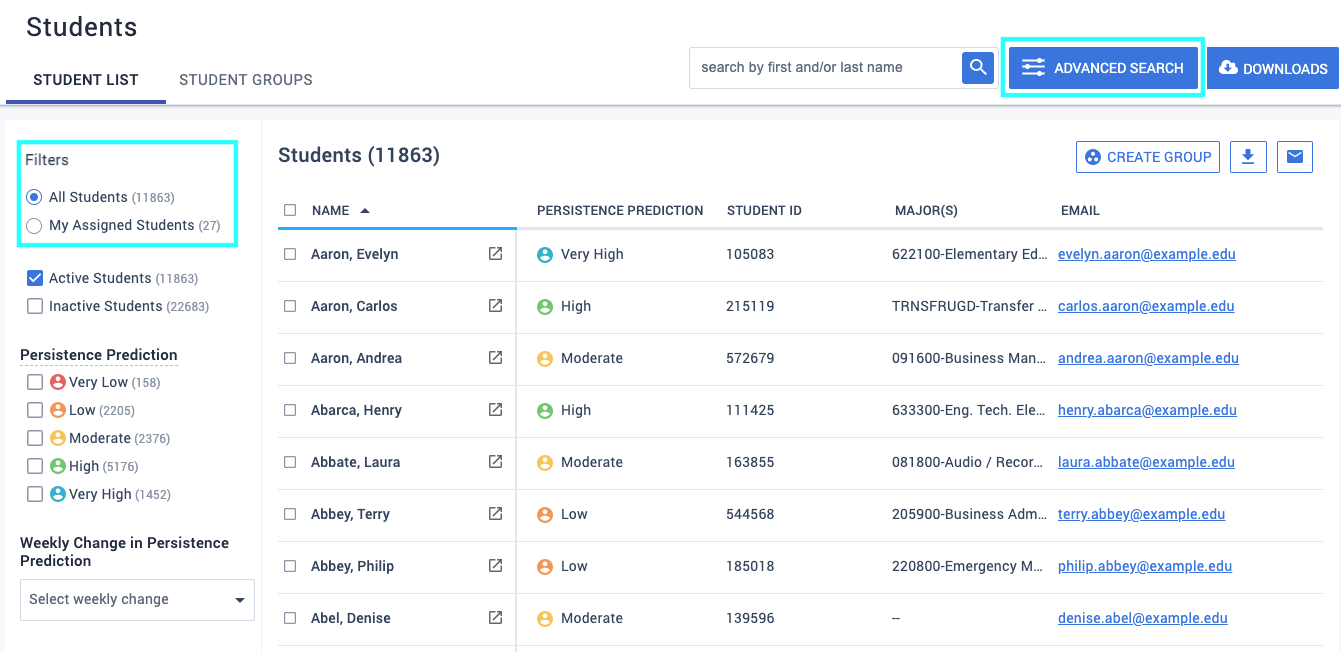
Note: Based on your institution’s configuration, you may see different search fields than those shown.