Getting Started
When your Analytics deployment is completed, you will get an email with the link and credentials needed to log in. If your institution implemented SSO (single sign-on), just use your usual sign-on.
Find Course Insights
From the Dashboard (home icon) of Administrative Analytics, Course Insights appears as a tab at the top. Course Insights has two main views:
Course Explorer
Course Explorer displays the courses that are most predictive of graduation or persistence for the Focus Area and any filter group you chose. The chart groups the most predictive courses by the year in the academic career in which the course is most commonly taken.
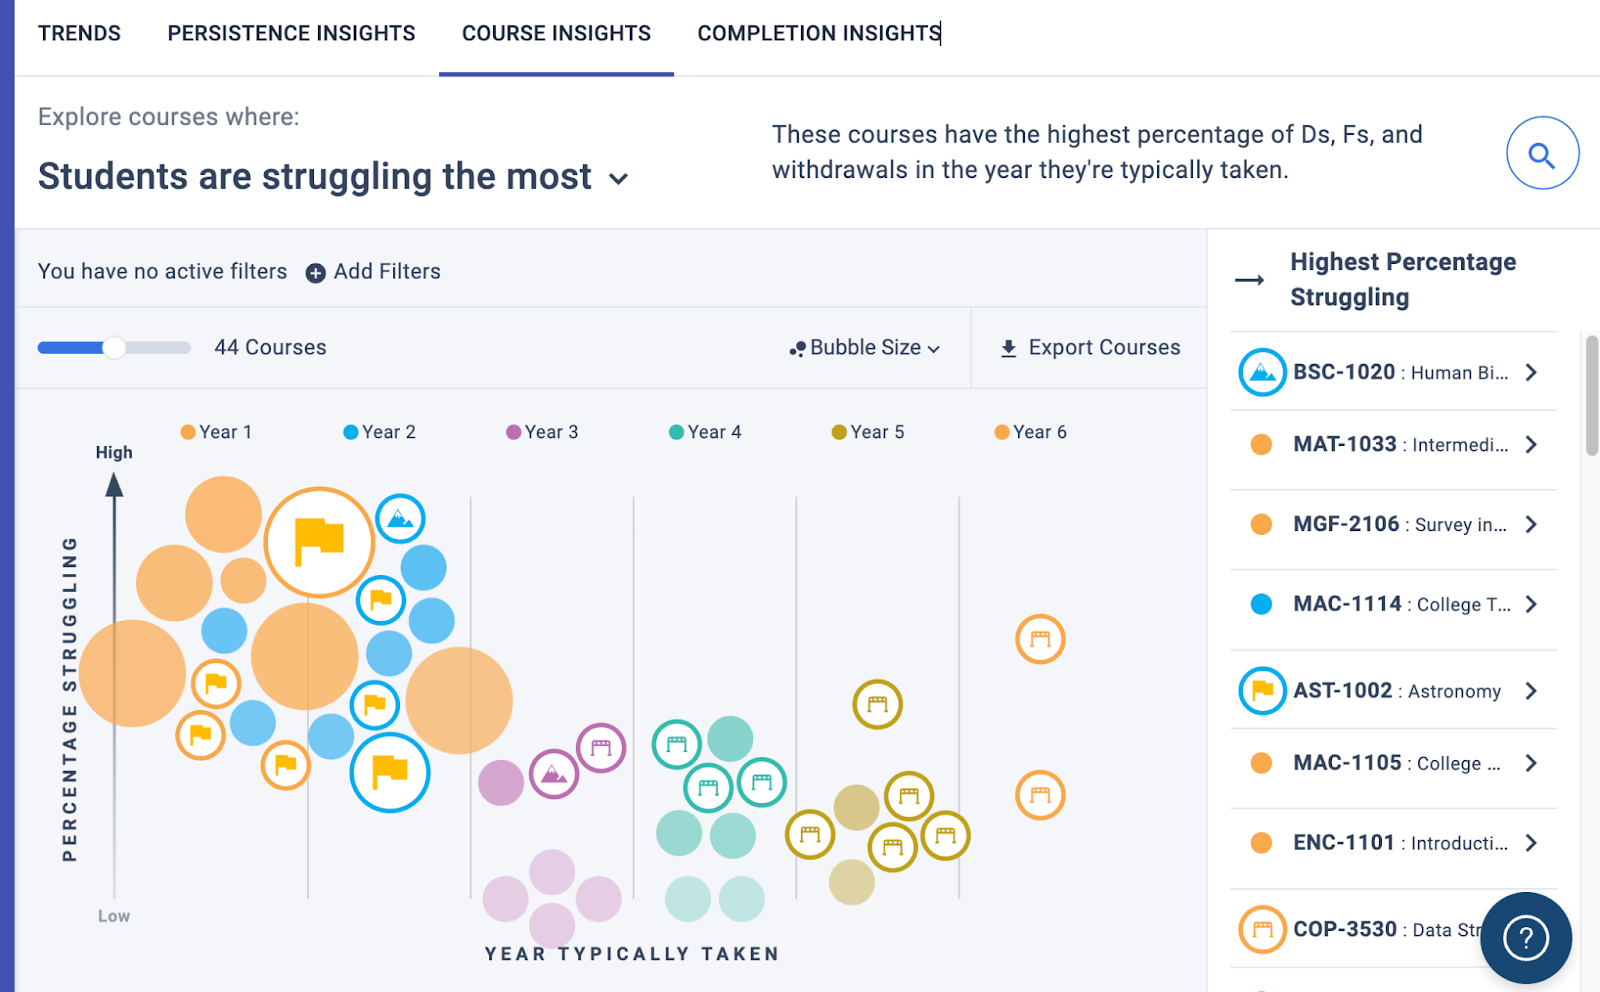
From this page, you can:
- Add filters to see how different student groups are impacted by different courses
- Choose a new exploratory Focus Area to view another distribution of courses
- Search for a specific course you need
- Slide the count to compare fewer or more courses at once
- Review the ranking of courses with the greatest impact potential
Course Details
Clicking Explore on any course opens its Course Details page. This page displays Key Insights about the course and how it compares to the average of other courses with both similar enrollment history and typically taken during the same year across graduation and persistence Focus Areas.
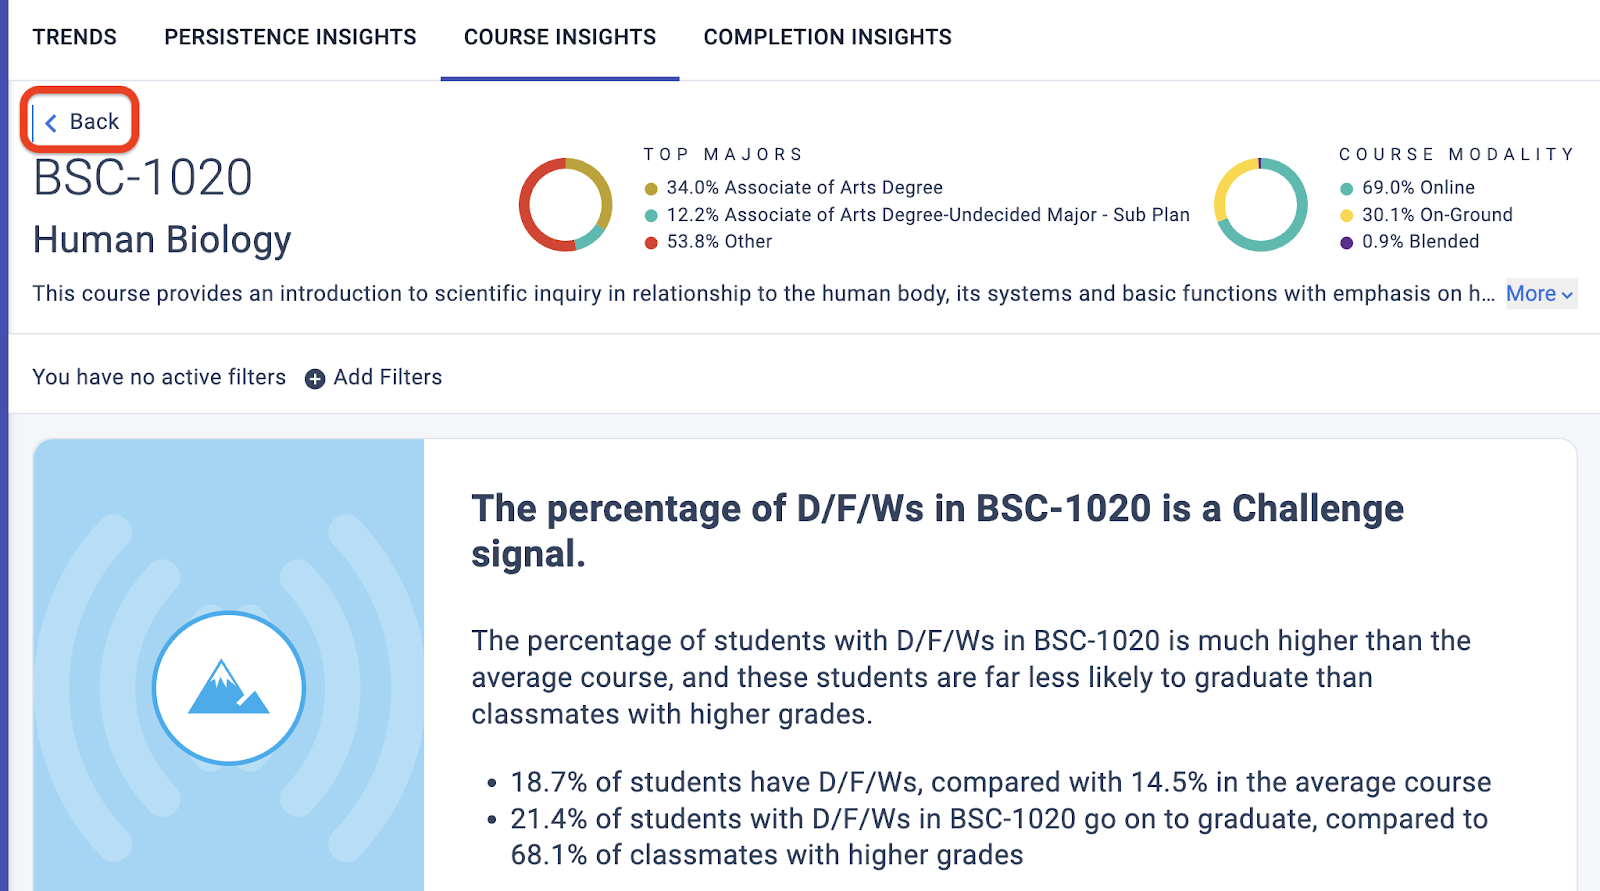
From this page, you can:
- See the breakdown of majors and modalities for a specific course
- Understand the implications of the associated course signal, if applicable
- Review enrollment information, including students currently enrolled, historical enrollment counts, and the year in the academic career during which the course is typically taken
- Adjust the filters to see how the course affects different students
- Compare the course to the average course at your institution on several metrics:
- Graduation likelihood by grade
- “Tipping point” grades (where it becomes better-than-average likelihood of success) and the graduation rate delta from the average course
- Course grade distribution
Ask a Question
You start using Course Insights by asking a question. From the Course Insights tab, click the Explore courses where: drop-down list to begin.
- First, decide whether to focus on graduation or persistence. (Persistence is retention: a student re-enrolling for a future term at your institution and staying enrolled past the census date, typically 14 days after the start of term.)
- Next, select one of three Focus Areas offered (you can try them all). Note that the courses that have the highest potential to boost graduation rates may differ from those that boost persistence.
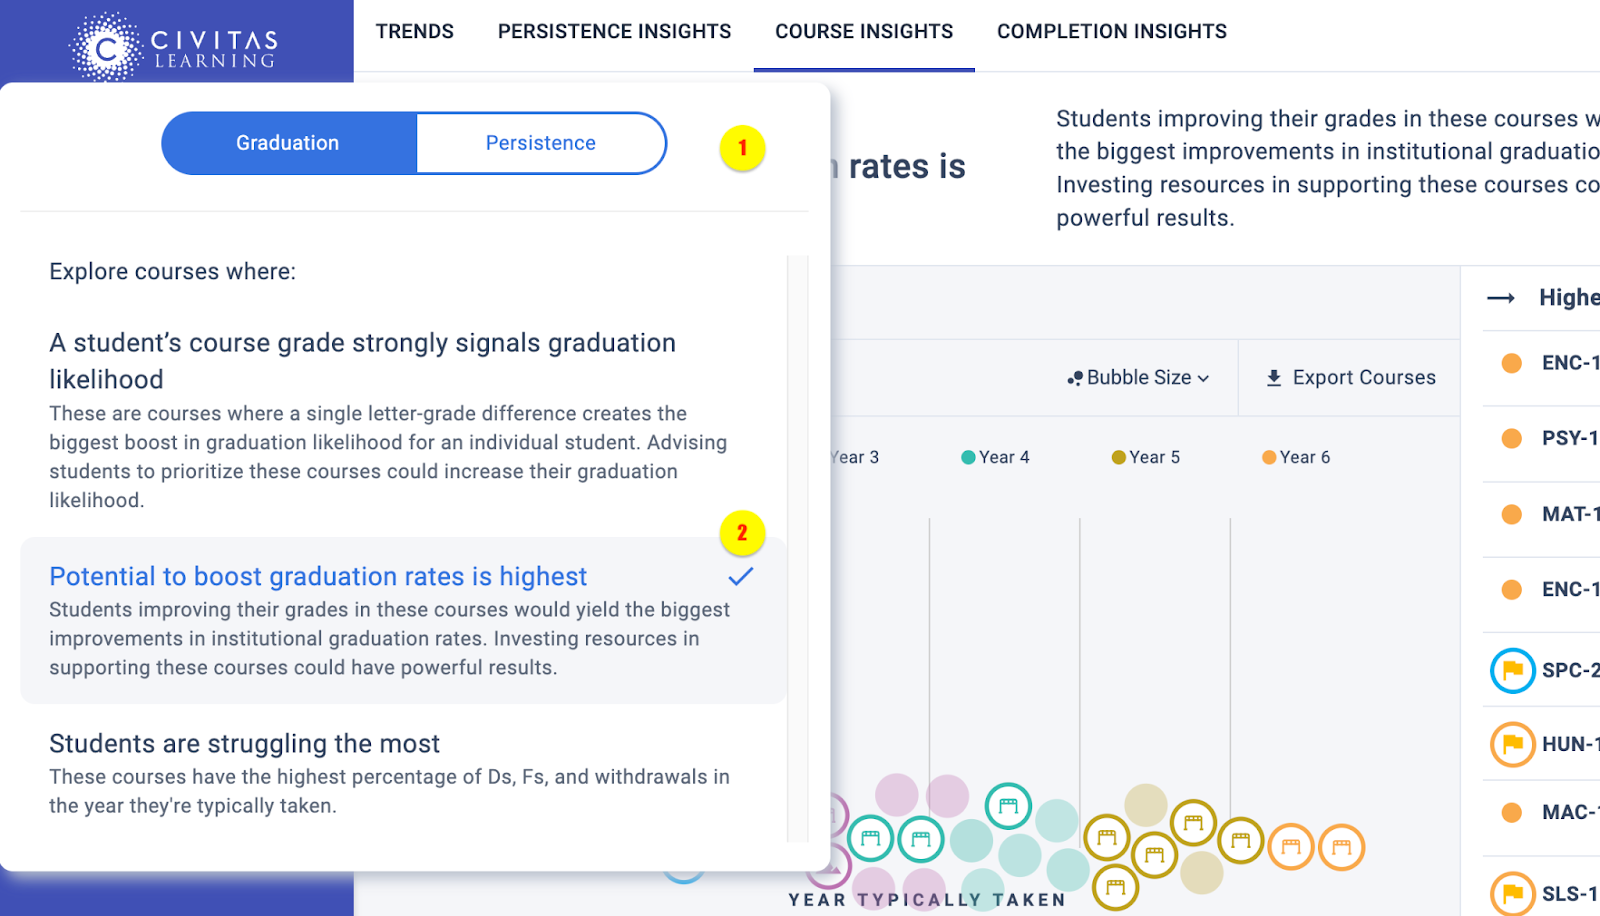
Focus Areas narrow the scope of your exploration. Each Focus Area will surface the courses that are most predictive of graduation or persistence with a focus on a certain outcome:
- A student’s course grade strongly signals graduation (or persistence) likelihood if a course grade increase by a single letter would significantly boost an individual student’s graduation or persistence likelihood. Grades in these courses tend to affect graduation and persistence likelihood more than the average course, which is determined by identifying other courses typically taken in the same year by similar students.
- Potential to boost graduation (or persistence) rates is highest when a letter-grade increase in the average course grade would result in a significant increase in graduation or persistence rates across all students in the filtered student group. Grades in these courses tend to affect a large number of students and present the greatest opportunity for large scale impact.
- Students are struggling the most when the course has the highest percentage of Ds, Fs, and withdrawals compared to other courses typically taken in the same year by similar students. Understanding why students in these courses receive these grades at a disproportionate rate could dramatically affect the courses’ future impact on graduation and persistence rates.
Filter Your Focus Area
Next, filter for courses that are most relevant to your role at your institution. Focus on a specific department or set of majors to uncover insights that apply to a certain group of students at your institution.
Focusing by Major
For example, as a department chair for psychology, you can target courses affecting psychology majors: Add a filter for psychology majors to view only the courses affecting psychology students’ graduation rates the most.

Focusing by Demographics. If your role involves managing advising staff or tutoring centers, you likely care less about which courses are predictive for certain majors than understanding which courses are predictive for certain student groups. You can apply what you learn many ways:
- Have advisors prioritize helping students in certain courses.
- Allocate more academic resources for certain courses.
- Market the resources available for a course that has a strong signal.
Tip: Deeper filtering uncovers insights that are the most actionable. By targeting specific students impacted by specific courses, you can isolate what to do and who should do it.