Explore Courses
Begin by selecting which outcome you want to explore for course signaling:
| Graduation | Students completed their last declared major. |
| Persistence | Students re-enrolled for a future term at your institution and stayed enrolled past the census date, typically 14 days after the start of term. |
When you select one of the buttons, the Course Explorer will refresh your choices for the focus area.
Tip: Change the focus area at any time by clicking the drop-down list below “Explore courses where:”
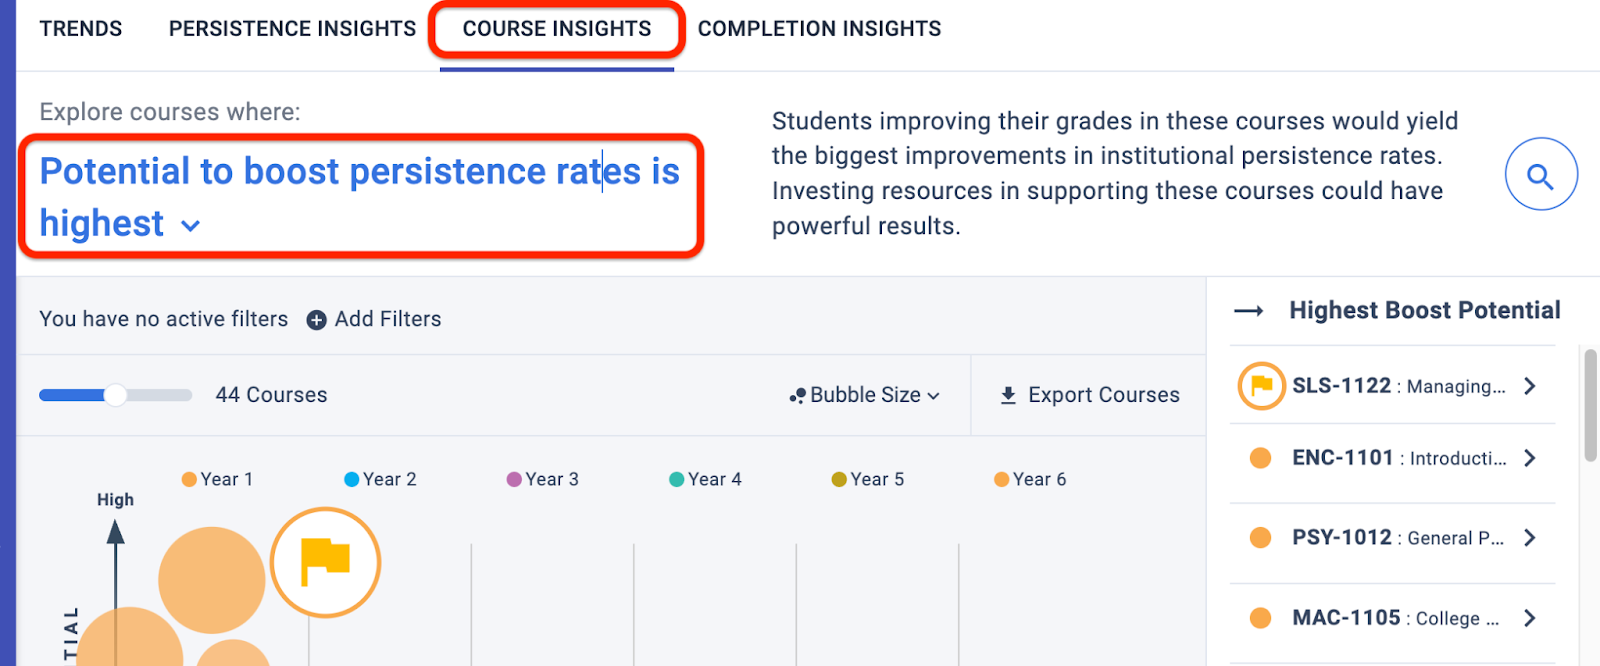
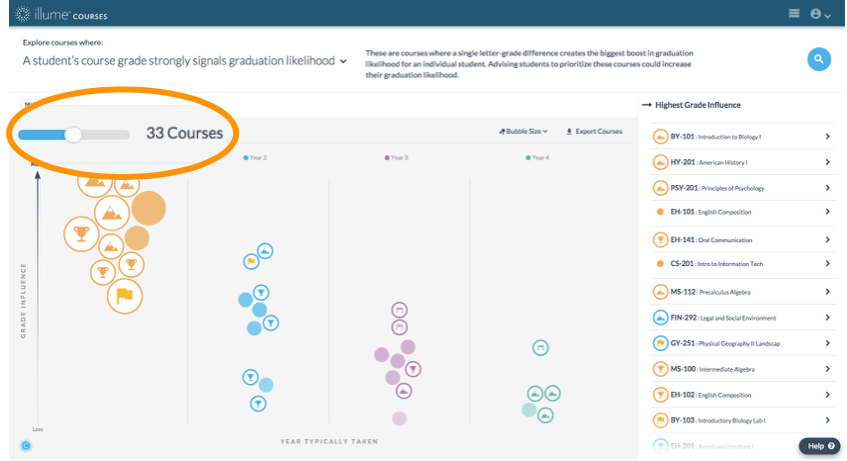
Choose a Focus Area from the drop-down menu. The Course Explorer chart will update automatically.

When you select one, the Course Explorer refreshes the bubble chart, with the chosen Focus Area determining how the courses fall along the vertical (y) axis:
- Grade Signal: Courses with the strongest grade signals are courses in which an individual student’s grade is a strong indicator of their individual likelihood to persist and/or graduate.
- Boost Potential: Courses with the highest boost potential are courses in which a lift in the average grade would yield the biggest improvements in institutional persistence and/or graduation rates. For these courses, filling students’ content and skill proficiency or mastery gaps could result in significant persistence and graduation increases.
- Percentage Struggling: Courses with the highest percentage struggling have the greatest percentages of Ds, Fs, and withdrawals in the year they are typically taken.
Filter students for targeted insights
Filters enable you to narrow down the courses included in the distribution based on specific student characteristics, such as the courses taken by students pursuing individual majors. Targeting a specific student group with filters lets you uncover more focused insights about the courses with the greatest effect on the group’s persistence and graduation likelihood. Each filter category has options that define various groups of your student population.
This is the standard set of filters that are included by default when your deployment is complete. Actual filters displayed in Course Insights will vary by institution.
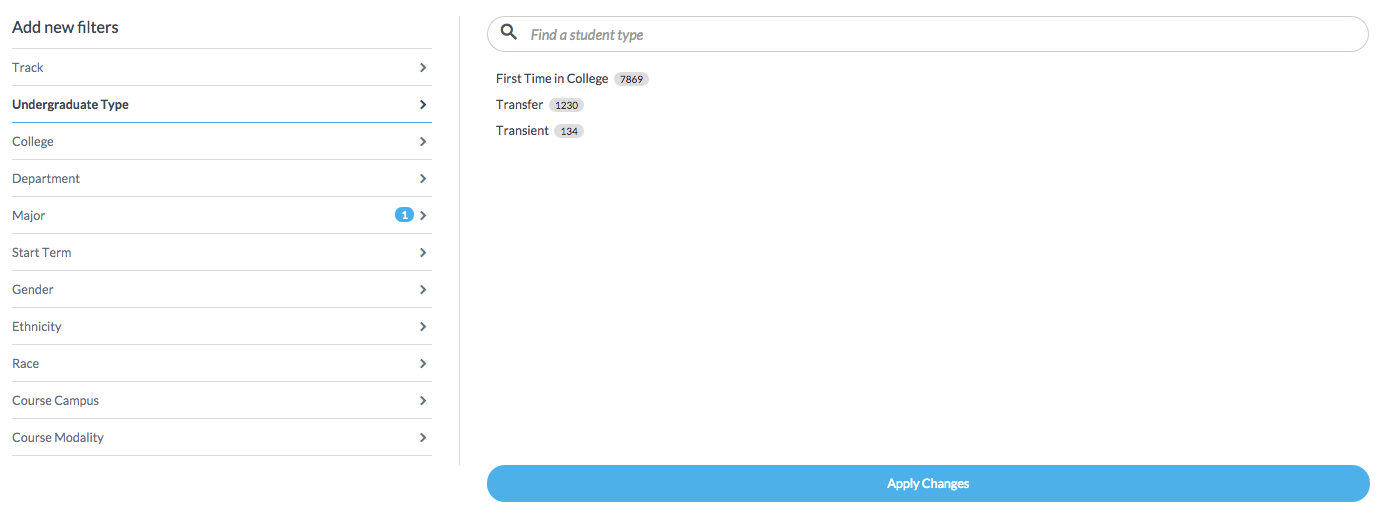
The available filter categories include:
| Track | If ‘Persistence Tracks’ have been defined in Analytics to differentiate groups of students with different enrollment behaviors, this filter surfaces courses with the greatest impact on the selected student track(s). |
| Undergraduate Type | Finds courses with the greatest impact on the selected undergraduate student type: first time in college, transfer, readmit, transient, high school dual enrollment, or unknown |
| Major | Finds courses with the greatest impact on students pursuing the selected major(s) at your institution. Students are associated with their most recently declared major. |
| Department | Finds courses with the greatest impact on students pursuing majors in the selected department(s). |
| College | Finds courses with the greatest impact on students pursuing majors in the selected college(s). |
| Start Term | Finds courses with the greatest impact on students who started at the institution during the selected term(s). |
| Gender | Finds courses with the greatest impact on students of the selected gender. |
| Ethnicity | Finds courses with the greatest impact on students of Hispanic or Latino descent or students who are not of Hispanic or Latino descent. |
| Race | Finds courses with the greatest impact on students of the selected race(s). |
| Course Modality | Finds courses that are all on-ground, all online, or blended. |
| Course Campus | Finds courses with the greatest impact on students who enroll in sections offered at the selected campus(es). |
See the count of students included within each filter to the right of the filter name.
Your institution may have added custom filters to these standard ones. If there is one missing that you need, contact your Civitas team about adding it as a custom filter.
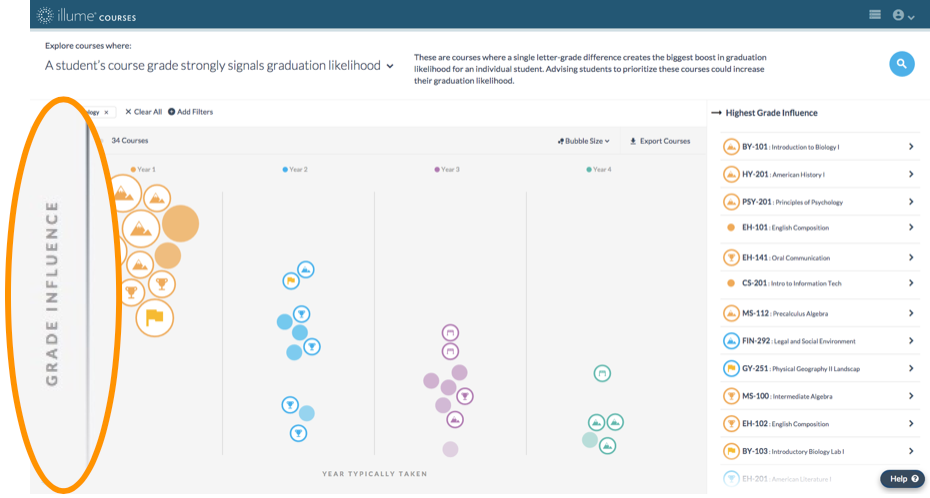
Selected Focus Area
As you change your Focus Area selection, the vertical (y) axis will update to reflect it.
- Courses that are highest on the graph present the greatest opportunity for impact at your institution.
- Courses with icons (course signals) have extra significance to explore.
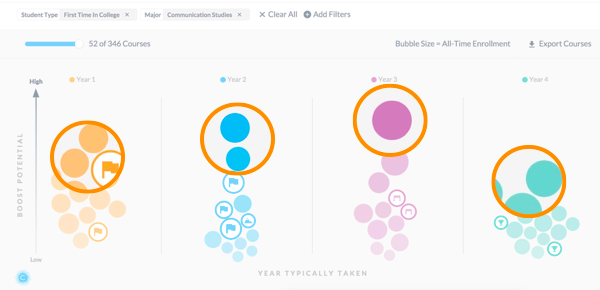
Focus on the courses with the highest potential impact by year to organize a strategy that accounts for the differences in students at each year in the academic career.
Important: Courses typically taken during the third and fourth year tend to chart towards the bottom, but don’t ignore them! These courses appear because they have the highest potential impact, so include them in your analysis.
Year Typically Taken
The horizontal (x) axis groups courses by the year in which a given course is typically taken. The year typically taken is determined by the year in the academic career during which most students take the course, also known as the mode year. The Course Explorer is organized by the year of the academic career, with each year distinguished by color. The number of years included in the display will vary by institution.
Tip: All of the courses associated with the same year share the same bubble color.
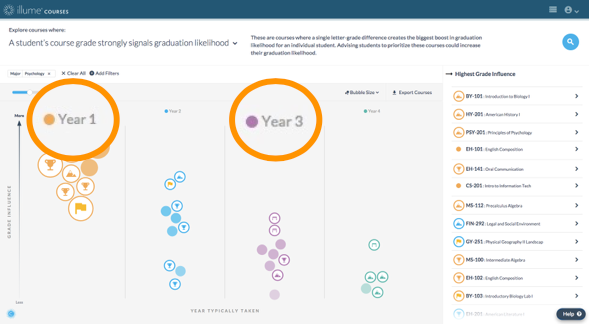
Interpret Course Signals
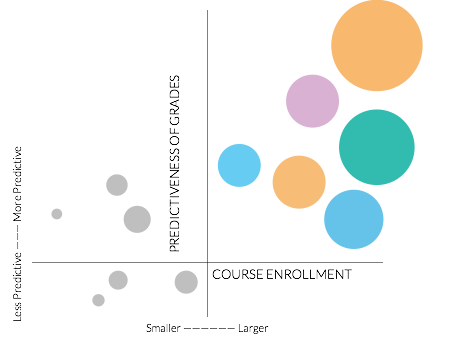
The Course Explorer surfaces the courses at your institution with two characteristics:
- The largest enrollments
- The most significant effect on a student’s likelihood to persist or graduate from your institution
Some courses in the Course Explorer get an icon that distinguishes them from the rest. These are course signals, which highlight a course’s most notable qualities. There are four signals:
Yellow Flag | Definition: Earning a C in a certain course is a Yellow Flag signal. Students with a C in the course tend to persist, but they graduate at a rate far lower than students who receive higher grades in the course. Action: Many institutions associate earning a C with successful course completion. For courses with a Yellow Flag signal, it may be necessary to understand the difference between a C and an A or a B. What is the competency gap and what effect does it have in future courses? Identify the students who received a C or below and follow up with them in subsequent terms to ensure they are on a path to graduation. |
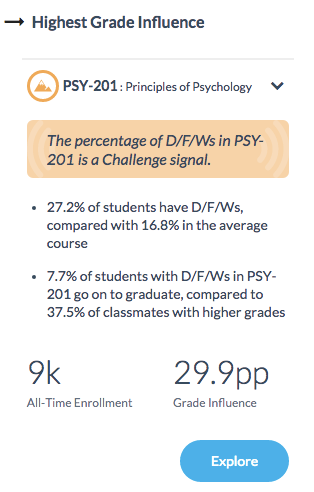
Challenge | Definition: A high percentage of Ds, Fs, and withdrawals in a certain course which also contributes to a reduced likelihood to graduate is a Challenge signal. The percentage of students with Ds, Fs, and withdrawals in a certain course is much higher than the average course, and these students are far less likely to graduate than classmates with higher grades. Action: While Ds, Fs, and withdrawals may already be a red flag at your institution, a D, F, or W in this course is more impactful than similar grades in other courses. Examine the prerequisite skills and learning objectives for the course and provide additional academic support to these students. Understand and emphasize the core competencies and behaviors that students must master to pass the course. |
Late Hurdle | Definition: The impact of grades in this course relative to other courses taken in the same year is a Late Hurdle signal. Students usually take this course in their third year or later, and their grades are twice as influential as those in other courses taken the same year. Action: Focus advising and faculty resources to ensure that students currently enrolled in these courses are supported. Understand what proficiency or mastery in this course looks like and what skills contribute to graded assignments in the course. Encourage students to focus their efforts on these courses to ensure that they make it to graduation. |
Qualifier | Definition: Earning an A in a certain course is a Qualifier signal. Only students with an A have an above average chance of graduation compared to their classmates. A grade of a B or below, in these courses, is an indicator that students may have content or skill gaps that will impact them later in their academic careers. Action: This course may require more academic resources such as tutoring or extra teaching staff. Identifying students who have earned a grade below an A in this course and reaching out in later terms will be key to getting them to graduation. |
Other high-impact courses are shown as solid-colored bubbles. These courses are very predictive of persistence or graduation at your institution, but they don’t fall into a specific course signal category. Many of these courses surface closer to the top of the Course Explorer and have significant potential for impact along with a large enrollment population.
Interpret Course Rankings
The full listing of every course in the distribution appears in the panel at right. Courses are ranked in order of the greatest potential impact based on the selected Focus Area.

Hover over any bubble or click a course name from the list to view facts about the course:
- The course name and number
- The associated course signal or the ways in which the course differs from the average course
- Persistence and graduation likelihoods (if there is an associated course signal)
- All-Time Enrollment count
- Boost potential, grade signal, or percentage struggling (Ds/Fs/Ws) depending on the selected focus area

Select the Explore button to navigate to the Course Details for that course.
Search for a Course
Use the Search bar in the top right to find a course of interest. Type any course name or course ID number and matching results will populate as you type.
Depending on the enrollment size and predictiveness of the course, a corresponding course bubble may not appear in the Course Explorer. If you are still interested in exploring the course, click the course name to view its Course Details.

Course View Slider
Adjust the number of courses included in the Course Explorer by moving the slider in the upper left corner. The minimum and maximum values will vary by institution.
Each colored bubble represents one course. The number indicated along the slider will match the number of bubbles shown in the graph..