Course Details
After you open a course to explore, start at the top of the page:
- Top left: Basic course information
- Top right: Composition of the course by major and the breakdown by modality
These breakdowns are representative of the trends across all terms of historical data provided by your institution. By learning which students take this course and by which modalities, you can effectively target your outreach and initiatives.
Below the course information and major and modality breakdowns, explore other data points about this course to inform your understanding of the student population affected by the course.
At this point, consider adding filters to view Key Insights for distinct student groups taking this course.
Discover Key Insights
Next, scroll down the course detail page to see the Key Insights section. Key Insights data applies to the impact of this course on the filtered student group.
Start by selecting Graduation or Persistence to see the course’s potential impact across several metrics compared to the “average course”.
What is the “average course”?
The average course is determined by identifying the top 25 courses (those with the largest enrollment) that are typically taken in the same year (mode year) as the selected course by similar students (those meeting the criteria of the filtered student group). The historical average across all 25 courses is calculated for each Key Insight.
Tip: To see which courses were included in the calculation, click the Avg Course column header.
Key Insight Questions
Key Insights pose questions about the course’s impact on persistence and graduation.
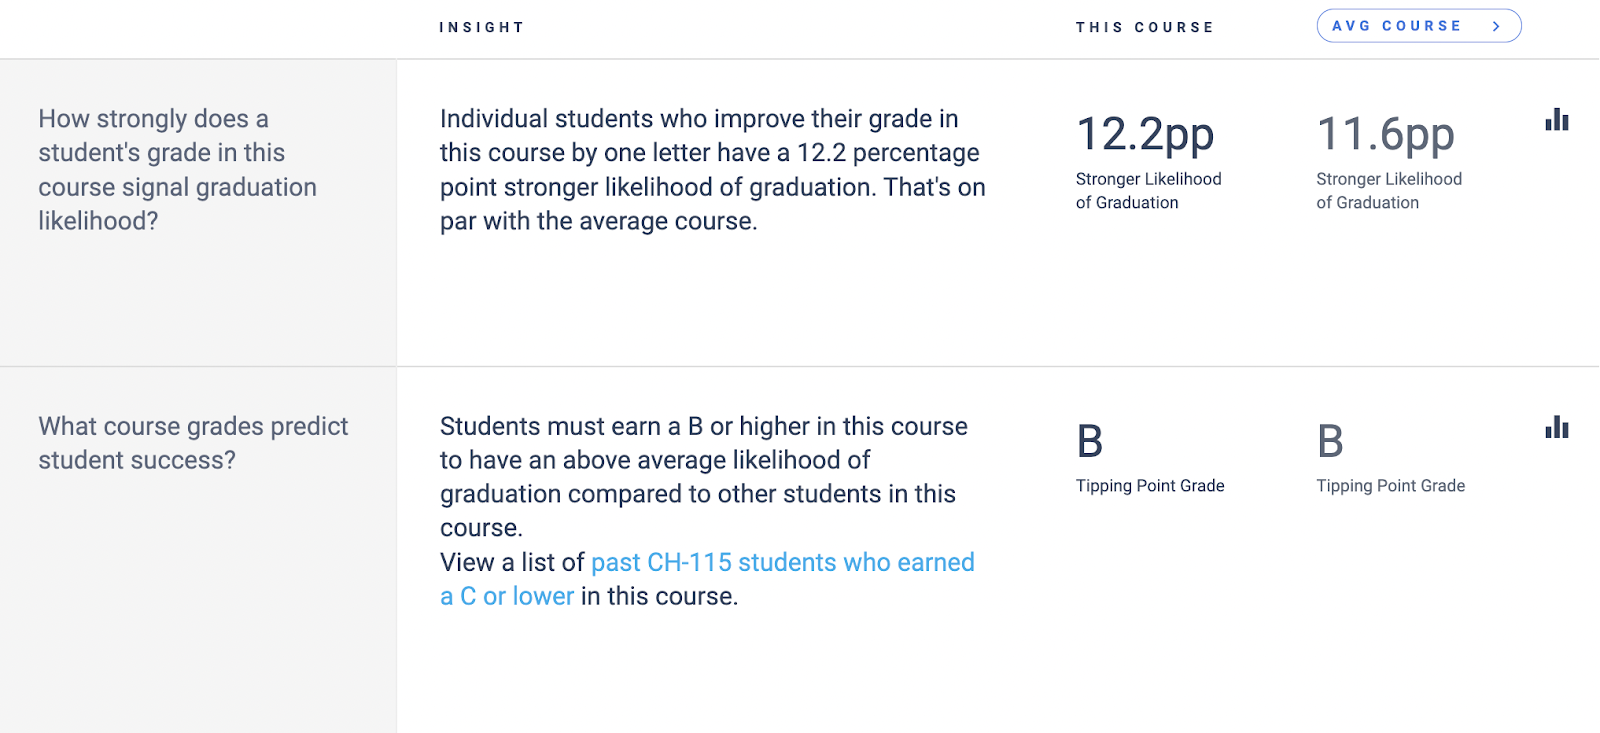
The left column notes the question and the right column summarizes the impact of this course compared to the average course and charts the course’s impact and distribution of grades.
| KEY INSIGHT QUESTION | INSIGHT SUMMARY AND EXPLANATION |
| 1. How strongly does a student’s grade in this course signal persistence/graduation likelihood? | This question explores how an improvement of a single letter grade can affect a student’s persistence or graduation likelihood. The improvement of a single letter grade is a proxy for improved course content and skill proficiency or mastery.Click the small graph icon to see a corresponding chart of Graduation (or Persistence) Likelihood by Grade. This chart shows the graduation/persistence likelihood for a student with each letter grade in the average course. |
| 2. What course grades predict student success? | This question surfaces the tipping point grade for the course, or the letter grade required for a student to have an above average likelihood of graduating or persisting.Click the small graph icon to see a corresponding chart of Graduation (or Persistence) Rate Delta. This chart shows the graduation rate delta at each letter grade, or the distance from the average graduation/persistence rate of students who have taken this course. |
| 3. How many students are struggling in this course? | This question identifies the percentage of students that earn Ds, Fs, or withdraw from the course. How does this percentage compare to other courses that are taken during the same year?Click the small graph icon to see a corresponding chart of the Course Grade Distribution.This chart shows the average grade distribution over the historic terms of data. |
| 4. What is this course’s potential to boost graduation rates OR How much does student performance in this course influence overall institution persistence rates? | This question uses data from the impact of a single letter grade increase for one student to project the potential lift in persistence and graduation rates across the filtered student group. This insight reveals the possible lift in persistence and graduation rates if all students in the filtered group improved their course grade by one letter. |
The values surfaced in the Key Insight summaries are also located to the right of the summaries in the column labeled This Course.
Compare the values for this course to the average course to understand how this course affects the student population or filtered student group differently from other courses taken by similar students during the same year.
Take action using student lists
You can take immediate action on Key Insights for a certain group by accessing a student list.
Course Insights delivers two types of student lists:
- Active students who are currently enrolled in the course
- Active students who received a grade below the tipping point grade in the course
1 – To view a list of students meeting the filter criteria who are now taking the selected course, click the number below the Current Enrollment heading on the Course Details page. Sort the list by student ID, or first or last name.
2 – To view a list of students meeting the filter criteria who are currently enrolled at your institution and received a grade below the tipping point grade in this course, click the prompt in the second Key Insight summary. Sort the list by student ID, first or last name, or course grade.
For either list, click the Export Student List button to generate a .CSV file, which you can open in your spreadsheet application. The file will include the student ID, First Name, Last Name, Email, Phone Number, Course ID, and Section ID for each student.
Important: Exporting any student list will generate a file containing student PII, which must be protected. Follow institutional policies and applicable laws when you store and share these files.
Apply filters to see details for a specific group of students
After reviewing the major and modality breakdowns for a specific course, you can look at the impact of this course on students pursuing a specific major or students taking one modality of the course. Filters appear below the course information and the major and modality breakdowns.
Click Add Filters to select from the filter categories and see how a course impacts those students specifically.

Remember: If you applied filters on the Course Explorer page, the same filters are still in force when you view a single course.
- To narrow your results, click Add Filters to select additional filters.
- To remove a filter, click the “x” to the right of the selection and click the Apply button.
Tip: For a course that has been redesigned, filter by time to check for any impact. Add start term filters to see how this course has affected success rates in the time since the course was changed.