Analytics Updates
-
Analytics Updates
- Finer Permissions Control
- Standalone Access for Course Insights
- Collapsible Side Menu
- Product Naming Updates
- Completion Insights Dashboard
- Completion Predictions in Data Warehouse
- Persistence Model Retraining
- Enhancements to Powerful Predictors
- Powerful Predictor Dashboard
- Enhancements to Student Lists
Analytics Updates
These enhancements are listed in order of the most recent.
Finer Permissions Control
In this update: To give you greater control over who accesses sensitive features of Analytics, the User Management Access Permissions have been expanded to offer finer granularity.
Action needed: None. The new permission structure will not affect your existing users: their access remains the same until you edit their permissions.
In response to requests for greater control over who may access Course Insights and Course Demand Analytics, the User Management Access Permissions in Admin Analytics have been reworked to offer more control. The new structure supports many use cases about securing access to sensitive areas of student information.
All your existing users will keep their prior access until you edit their User account to change it. When you create new or edit existing user accounts, you can grant basic access to Administrative Analytics without granting access to some or all of these feature areas:
- Trends (Dashboard tab)
- Persistence Insights (Dashboard tab)
- Completion Insights (Dashboard tab)
- Course Demand Analytics (side menu)
- Scratchpad (side menu)
- Nudge Hub (side menu)
Standalone Access for Course Insights
In this update: To give you greater control over who accesses sensitive features of Analytics, Course Insights has been promoted to the main side menu and given standalone permissions that you can manage independently of those for Admin Analytics.
Action needed: None. The new permission structure will not affect your existing users: their access remains the same until you edit their permissions.
In response to requests for greater control over what users of Course Insights can see and do, the Course Insights tool has been moved out of the dashboard and promoted to the main side menu: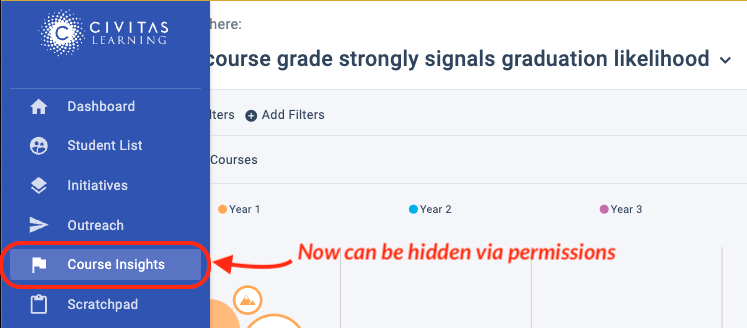
In addition, its permissions are now broken out so that you can achieve complete separation both ways:
- Grant use of Course Insights without permissions to any of the rest of Admin Analytics.
- Grant use of Admin Analytics without any access to Course Insights.
All your existing users will keep their prior access until you edit their User account to change it. When you create new or edit existing user accounts, you can choose the new permissions needed.
Collapsible Side Menu
In this update: The global side menu is now collapsible, which makes it consistent for Advising and Planning users and maximizes your workspace for wide data tables.
To provide greater screen space for all the tables in Administrative Analytics, the left-side menu is now collapsible. It now matches the behavior of Planning and Advising, so it is a consistent experience for your users. The menu expands dynamically when your mouse hovers over it, and it collapses when you mouse away. When expanded, the menu shows your logo at the top. 
Tip: The area set for your logo is a maximum of 150px wide by 60px high, and larger images are scaled to fit. If you have issues with how your logo appears, contact Support to update your file.
Product Naming Updates
In this update: You will now see updated product naming throughout Analytics, replacing the legacy names. This has no impact on your access and integrations, as no URLs have been changed.
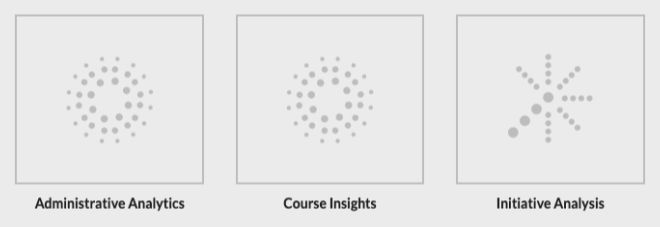
All references to “Illume,” “Impact,” and “Courses” throughout the application have been updated:
- Illume Students is now Administrative Analytics
- Illume Courses is now Course Insights
- Impact is now Initiative Analysis
The launch pad now appears with this wording for the applications:
Completion Insights Dashboard
In this update: With the new Completion Insights dashboard in Administrative Analytics, your team gets up-to-date completion progress statistics as well as individual completion predictions for your students.

These completion predictions are built from your institution’s data and reflect the unique student experience on your campus, using the same data modeling and machine-learning platform that power your persistence predictions. With these new completion predictions and insights, you gain a comprehensive view of how your students are tracking towards completion as well as strategic opportunities to act on now.
What’s included
- Multiple completion predictions per student, representing the likelihood of completing a credential within targeted time periods (such as within 3, 4, and 6 years)
- Completion prediction breakdown chart that lets your team quickly compare predictions across student groups and demographics (such as Full-time vs. Part-time) to surface which specific student groups need support, so you can advance your equity work
- Engagement Opportunities with one-click student lists, which make it easier than ever to take immediate action to engage with students
Completion Predictions in Data Warehouse
In this update: Building on the release of Completion Insights in Administrative Analytics, completion predictions are now available in the Civitas Learning Data Warehouse!
With these new data tables, your team can expand its reach:
- Use standard SQL queries to directly access individual completion predictions for your students and start-term cohorts
- Update your dashboards, reports, and applications using the predictions and derived data from the Data Warehouse
Completion predictions are built from your institution’s data, and they reflect the unique student experience on your campus, using the same data-modeling and machine-learning platform that power your persistence predictions. With these new completion predictions and insights, you gain a comprehensive view of how your students are tracking toward completion while surfacing precise, strategic opportunities to offer support to improve student outcomes.
Data Warehouse Additions — See the updated Data Warehouse data dictionary.
- Multiple completion predictions per student, representing the likelihood of completing a credential within configurable time windows (such as within 3, 4, and 6 years)
- Historic completion predictions that are captured for each student weekly, starting from today or the date of deployment if after
- Start term and completion window tables to help aggregate completion predictions across start-term cohorts and delineate predictions for different time windows
Persistence Model Retraining
The last few years have seen constant change across student populations and learning environments, with major shifts in student and course modalities, adjusted enrollment and grading policies, and evolving engagement behaviors. To ensure our predictive models continue to stay relevant and account for changes in your institution’s and students’ data, we have retrained your persistence models. The new models are now available in your applications!
What to Expect — The only change to your models is retraining to the most recent term data: typically including Fall 2019 – Summer 2021. No other changes have been made to your existing model algorithm or feature set. You may notice some shifts in the number of students assigned to the Very Low, Low, Moderate, High, and Very High persistence prediction buckets. Our testing indicates these impacts:
- Most of these shifts represent
- Significant changes in bucket distribution are likely due to score changes at the bucket cutoff thresholds (such as borderline Moderate/High)
Why Retrain? — These routine, periodic model retrains incorporate the most recent terms of data and persistence outcomes available, ensuring your models stay up-to-date with evolving student populations and institutional environments. Using the more recent term data for training, these new models will more accurately reflect what’s affecting your current students’ persistence likelihood. Our policy is to periodically retrain your models as new data or institutional changes become available and as our data science research grows. Contact support@civitaslearning.com if you have any questions.
Enhancements to Powerful Predictors
▶ View video: Enhancements to Powerful Predictors
In this video, we show the enhancements we have made to the powerful predictor experience. This video provides an overview of the newest changes and describes how these changes provide a better user experience.
Powerful Predictor Dashboard
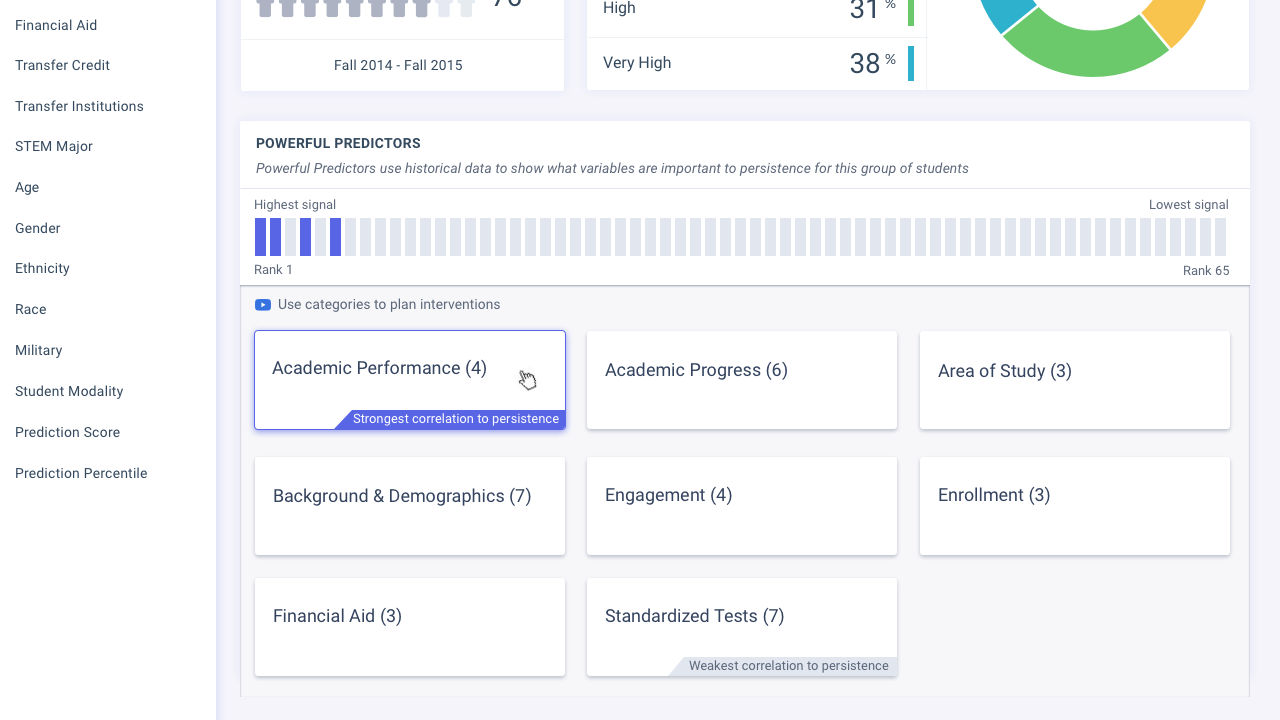
We made significant improvements to Powerful Predictors, curating down the list of Powerful Predictors to be easier to take action, and introducing category tags to help you better understand which group of factors most affects persistence. We’re excited to introduce the next phase of this effort – a Powerful Predictor dashboard, using the category framework, designed to give you a quick sense of what matters for the group of students you’re investigating.
Hovering over each category, you can also get a feel for the distribution of Powerful Predictors ranking, and by clicking into each category you get to a ranked list of Powerful Predictors like you see today. In addition to the dashboard, we’ve further refined the list of Powerful Predictors, removing redundant features and making changes to a few existing ones to be even more intuitive and actionable.
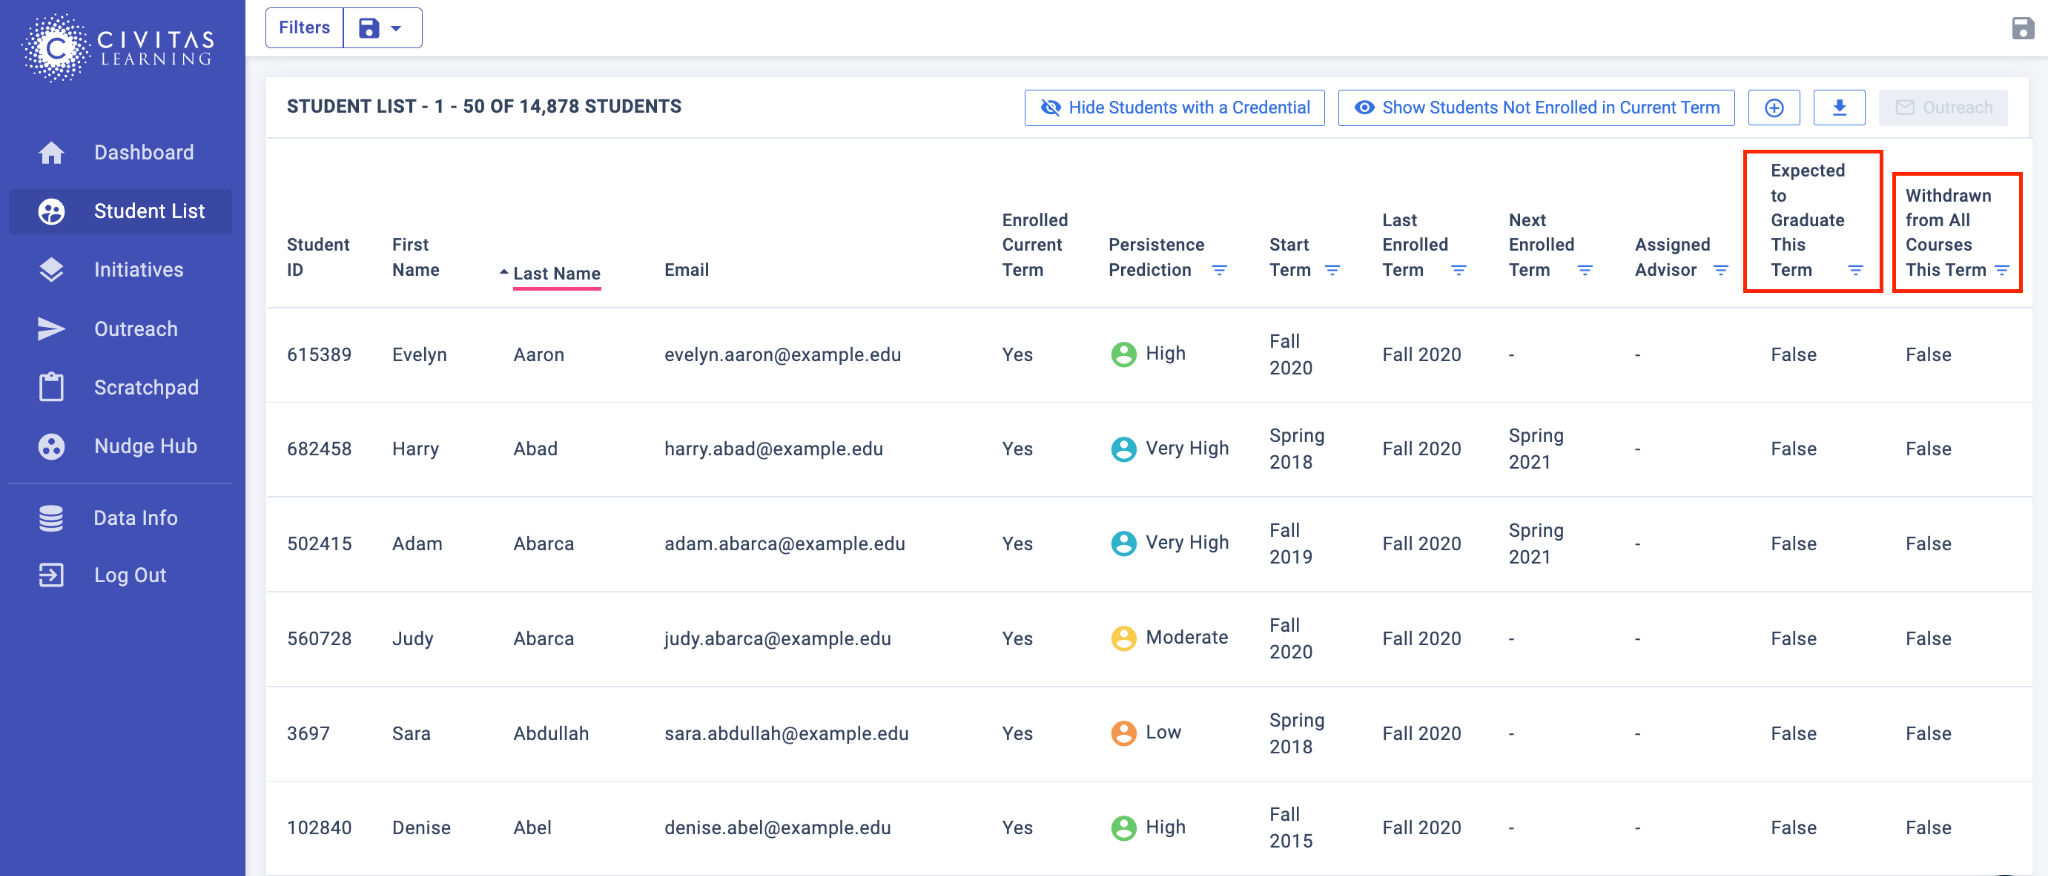
Enhancements to Student Lists
To more easily find and add the data you want to a student list, we’ve organized the data columns that can be added using the new Powerful Predictor categories. Quickly add “Academic Progress” or “Financial Aid” data points using the new category organization. We’ve also added a “Frequently Used” category, to quickly get to the most commonly added data points, such as GPA (Cumulative).
We’ve also added our first non-Powerful Predictor data fields – a column for “expected to graduate” as well as “withdrawn from institution this term.” This also means you can either filter exclusively for, or filter out, these students when pulling a student list.